Usage Stats
Usage Stats shows how ZCode is being used. It has two tabs: App Usage for local ZCode sessions, and Coding Plan for remote Z.ai / BigModel Coding Plan quota and usage.
App Usage
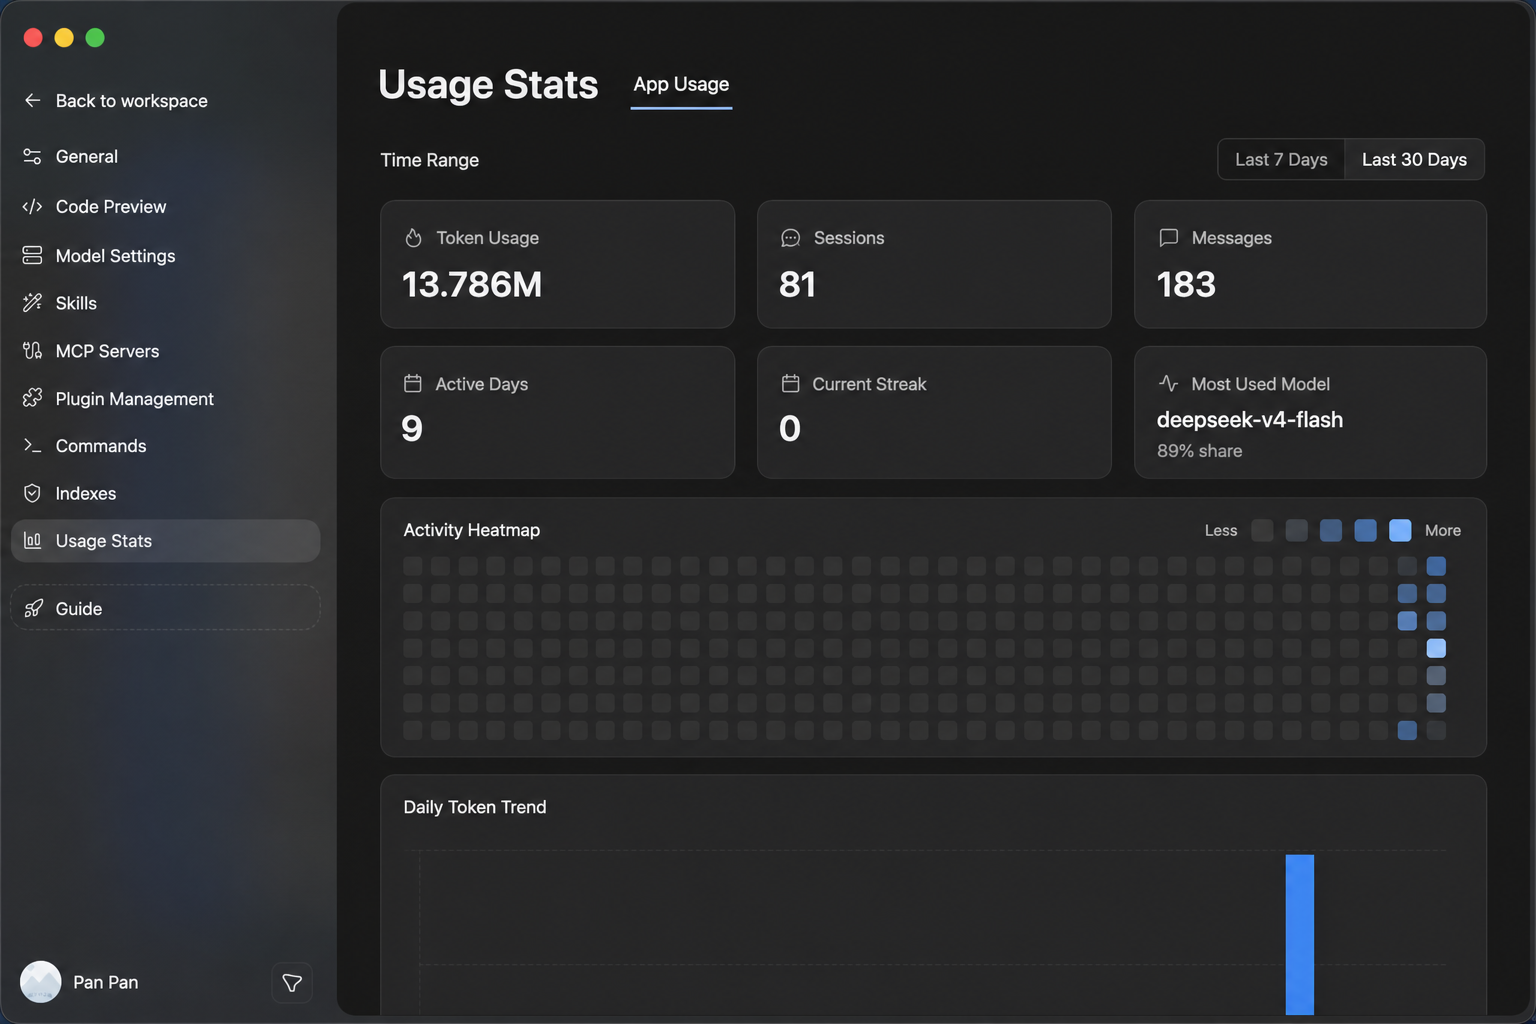
App Usage reads local ZCode session records on the current device. Use it to review recent work volume inside ZCode.
You can see:
- Token usage, sessions, messages, and active days.
- Current streak, longest streak, and peak hour.
- Daily token trends, activity heatmap, and model usage ranking.
Use the range switch in the upper-right corner to compare All Time, Last 30 Days, and Last 7 Days.
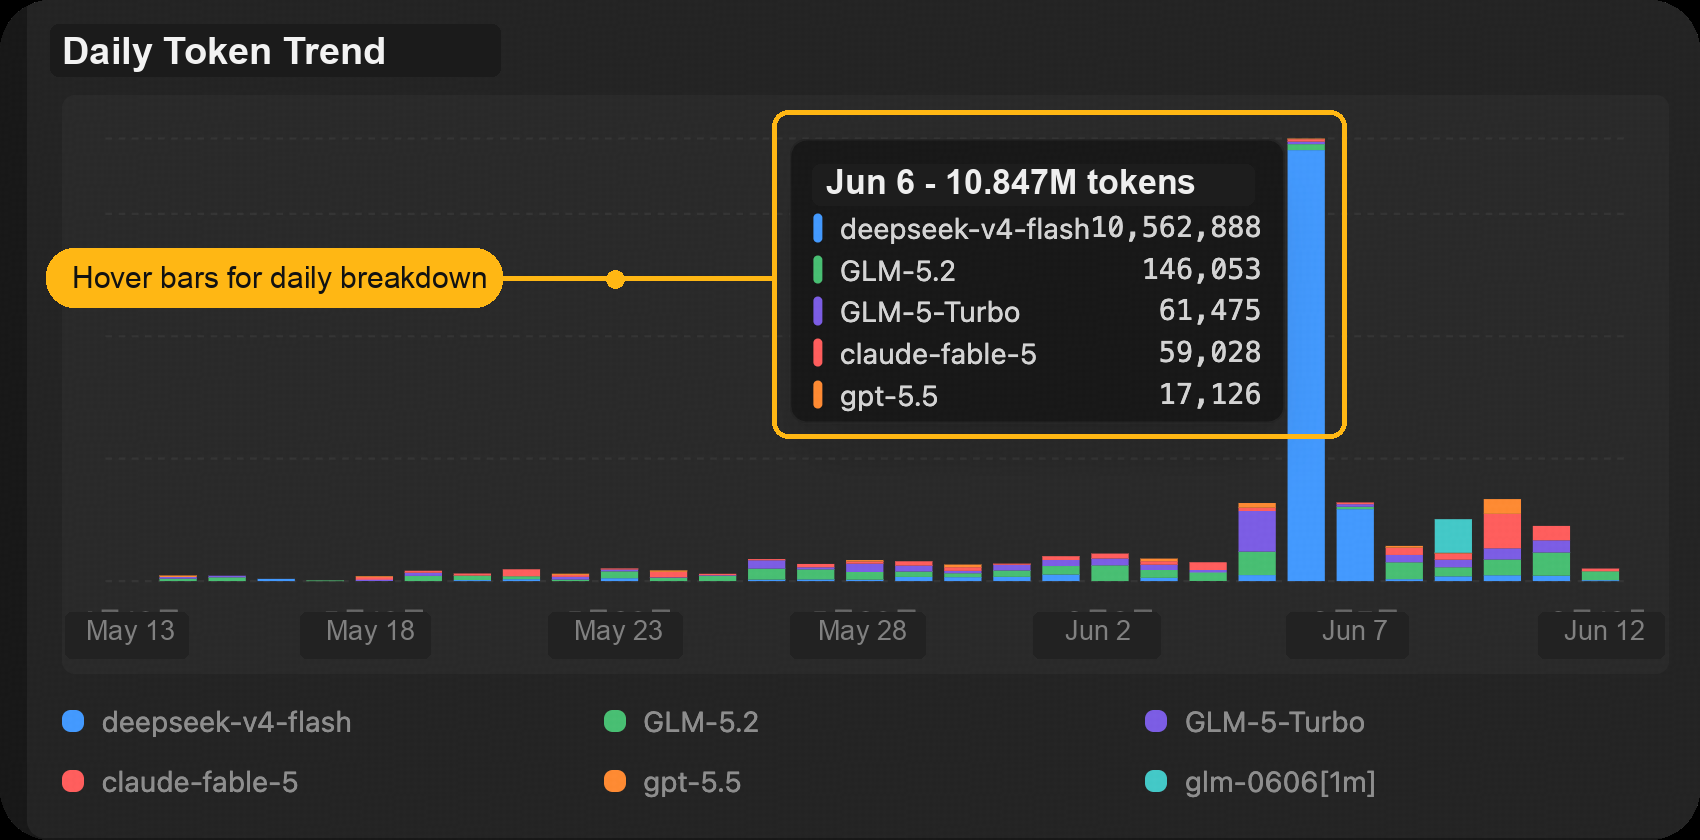
The daily token trend chart supports hover details for each day, including the token breakdown by model. Use it to spot usage spikes and understand which models contributed most on a specific date.
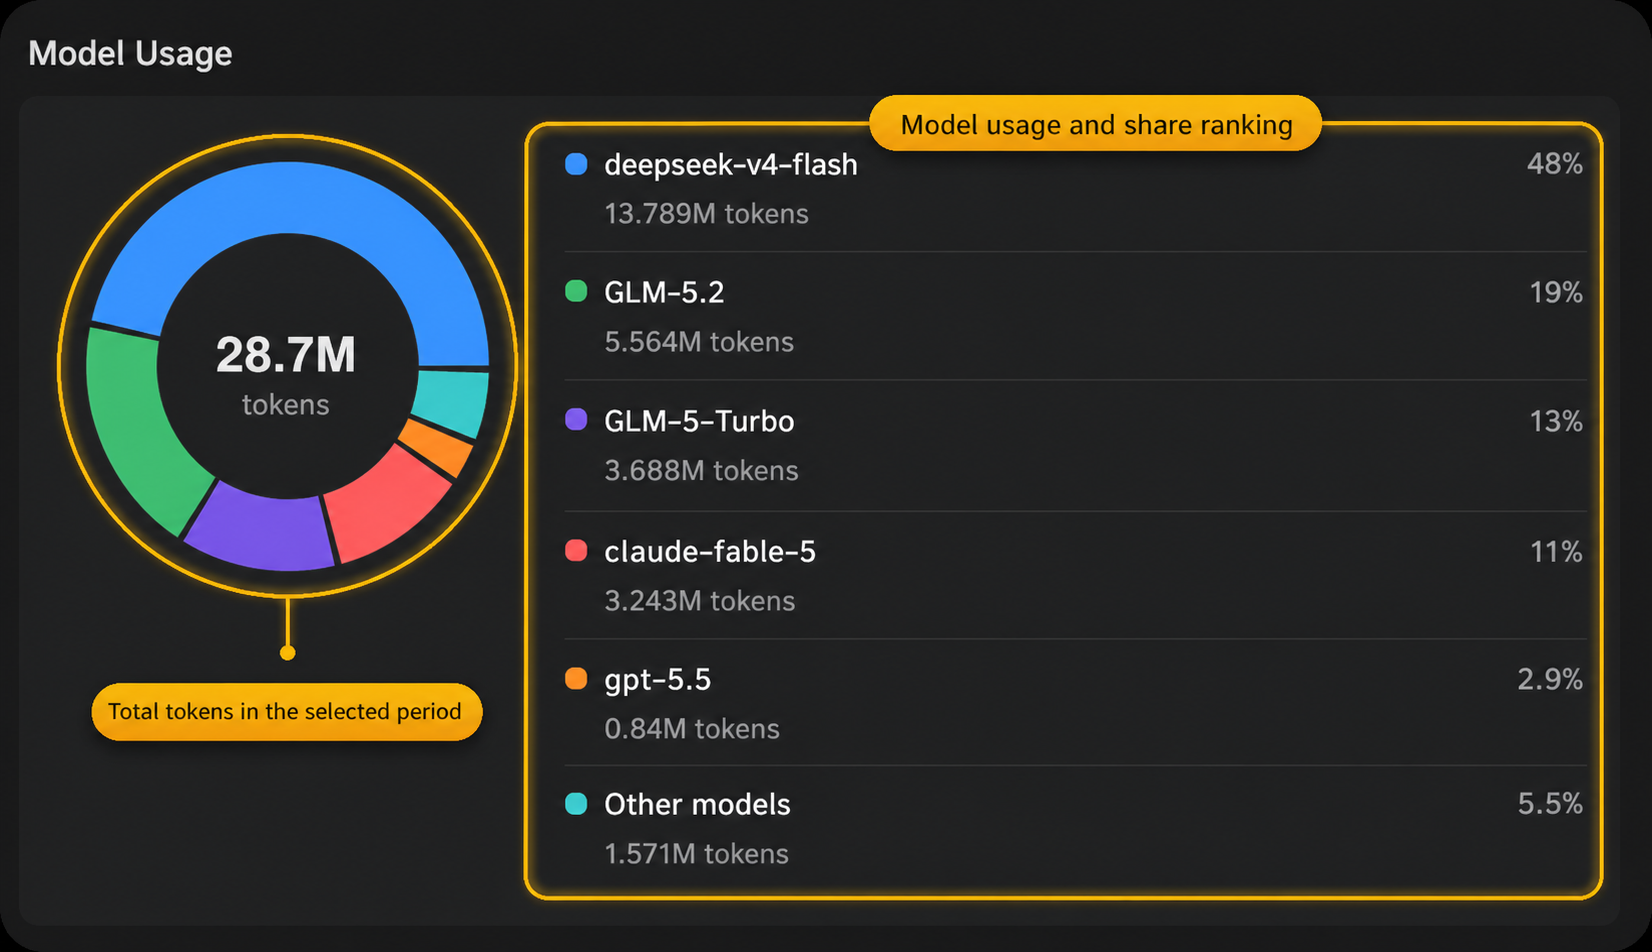
The model usage chart summarizes total tokens in the selected period and ranks each model by token share, making it easier to identify your primary models and compare usage distribution.
Coding Plan
Coding Plan reads remote Z.ai / BigModel Coding Plan statistics. Use it to check quota, model usage, and tool usage. The screenshot below uses Z.ai - Coding Plan as the example; BigModel - Coding Plan is supported in the same view with the same kind of quota and usage breakdown.
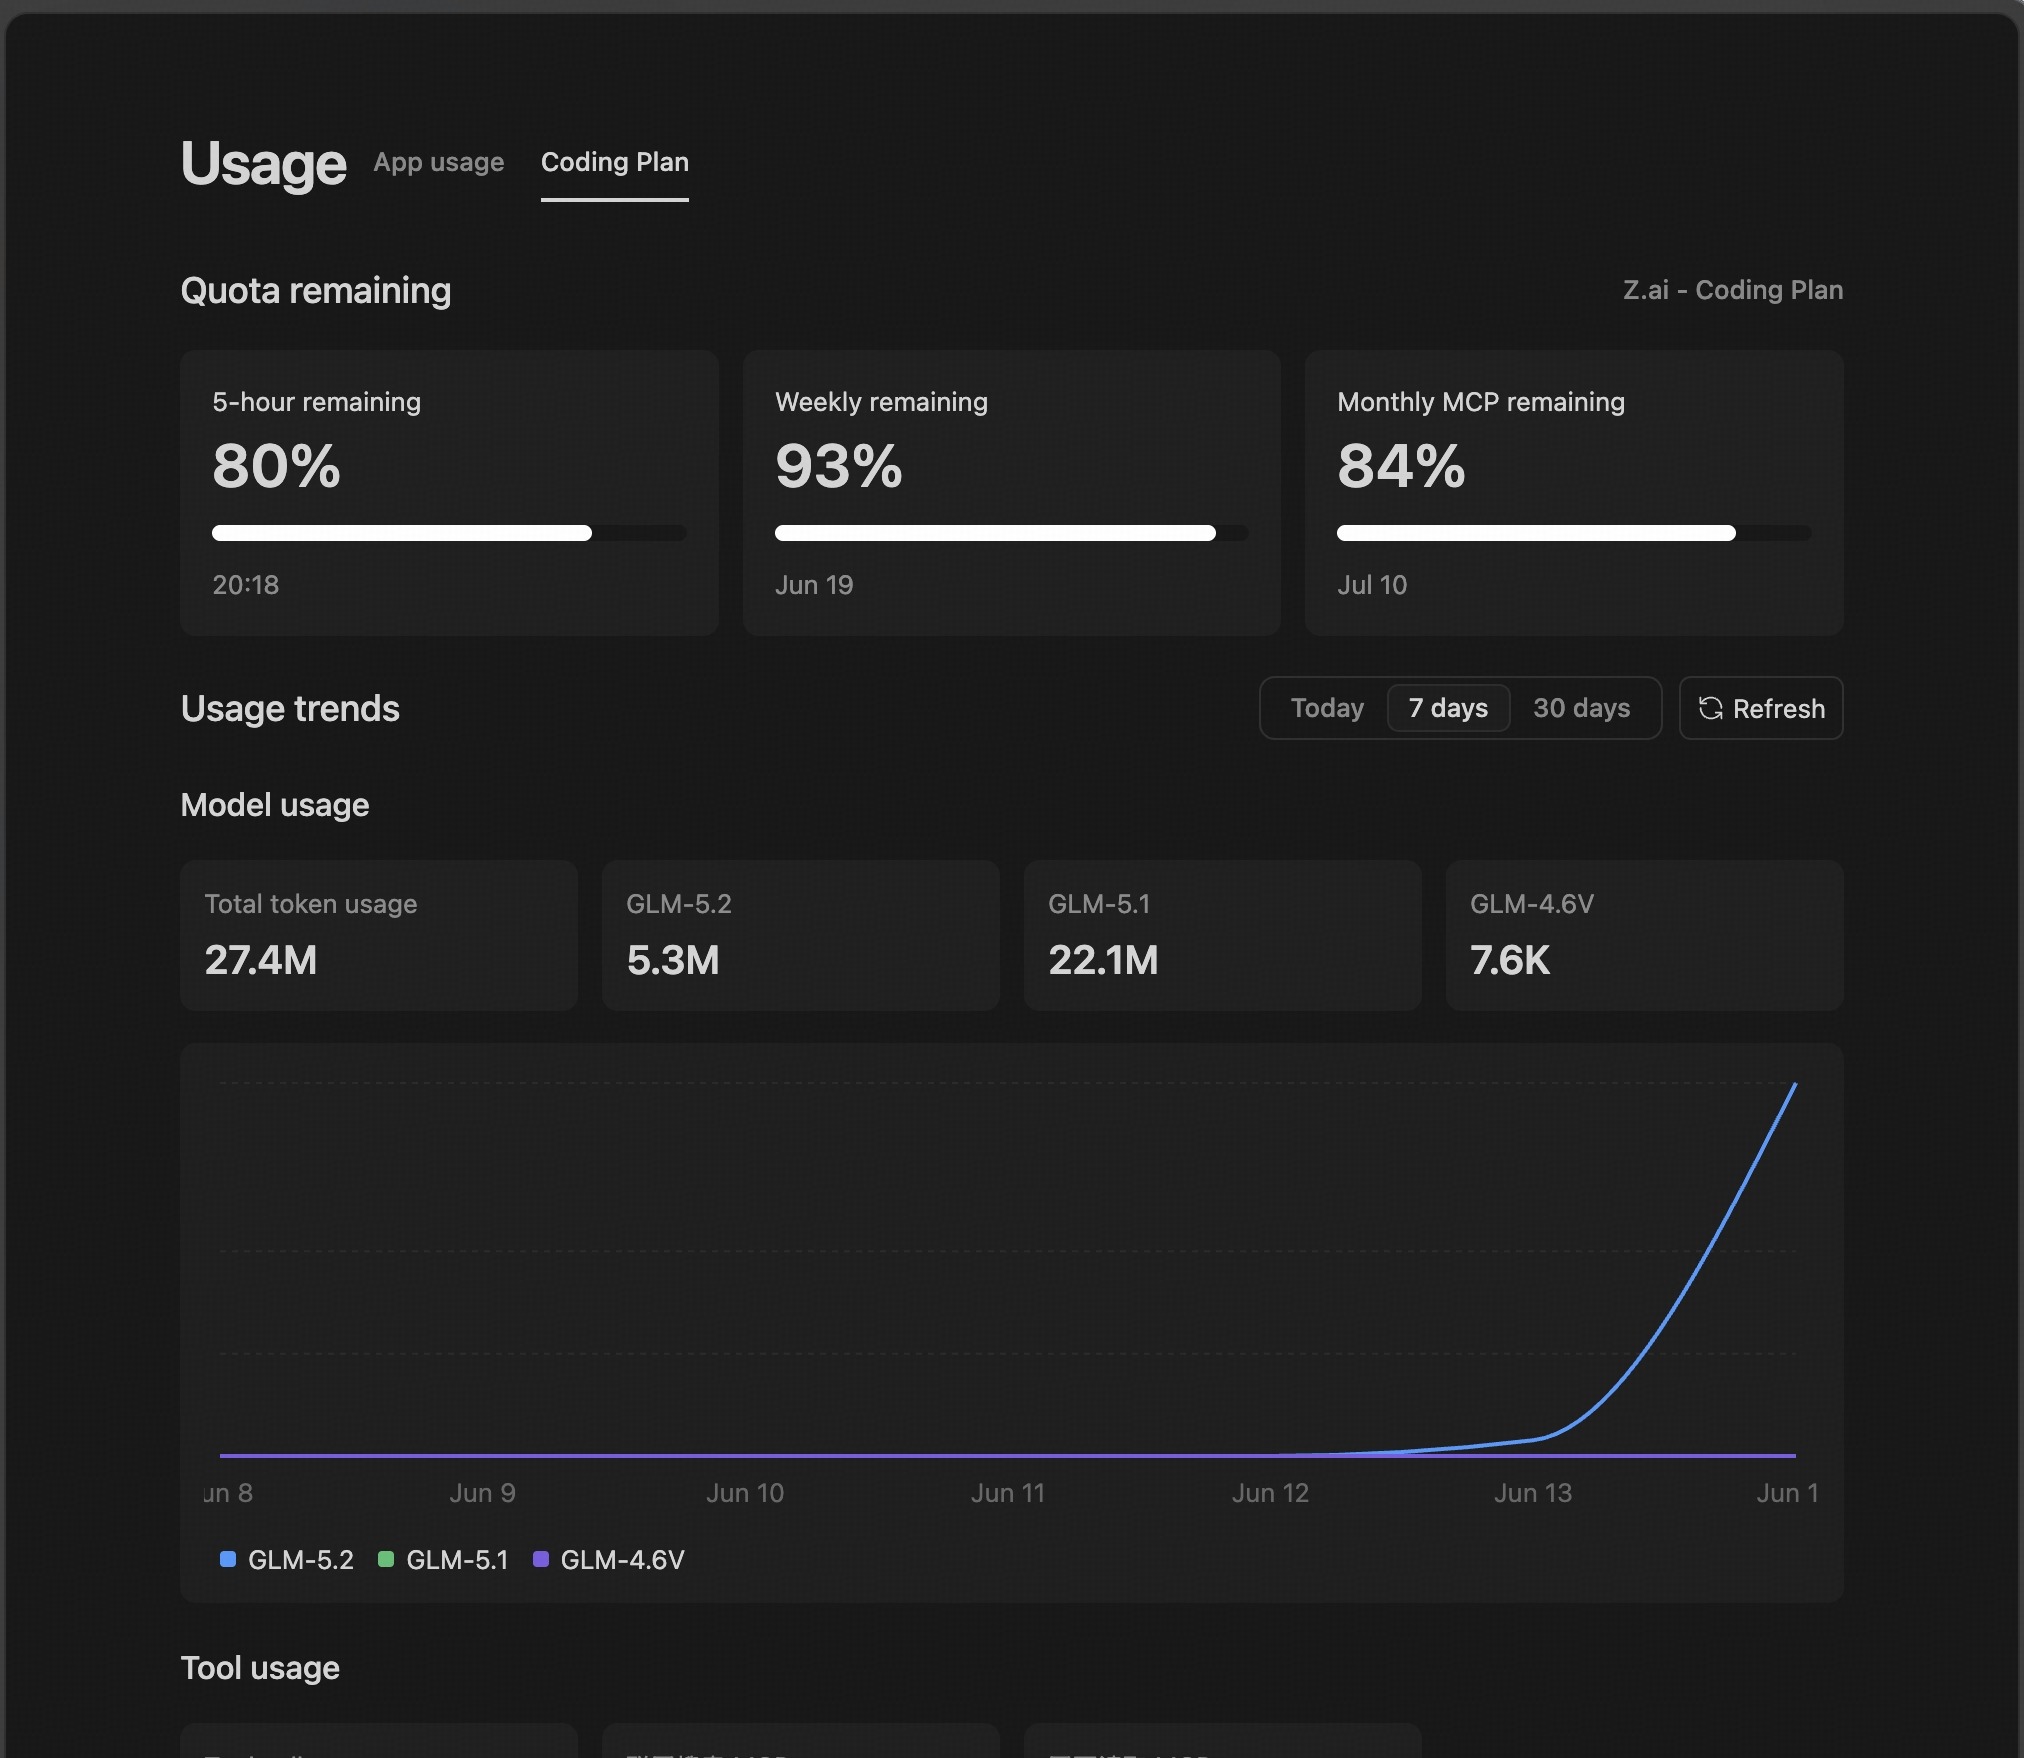
It shows:
- Quota status such as the 5-hour prompt pool, weekly quota, and monthly MCP quota.
- Token consumption for models such as GLM-5.2 and GLM-5-Turbo.
- Tool calls such as Network Search MCP and Web Reader MCP.
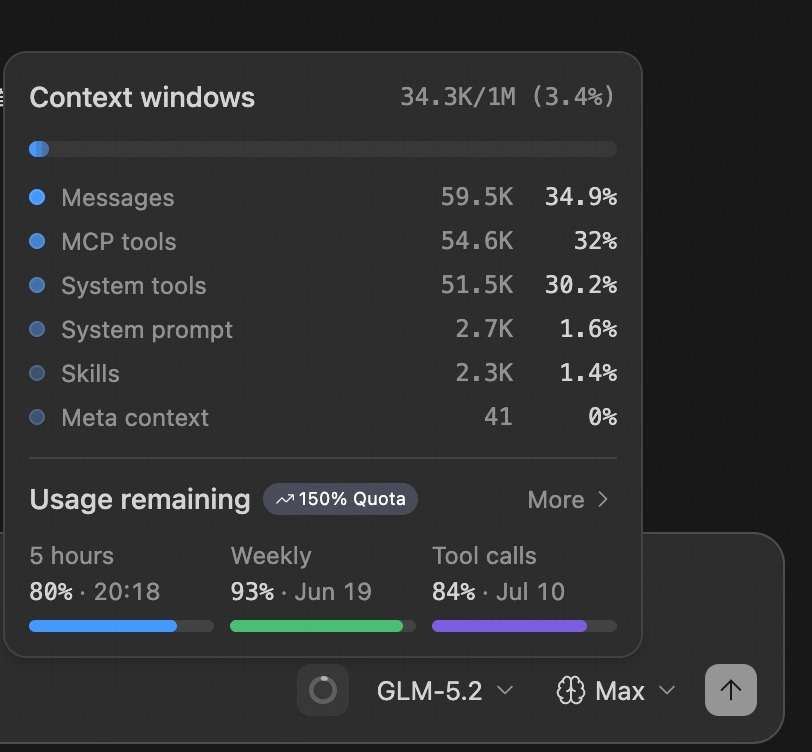
When you expand quota details, ZCode also shows the current context-window breakdown, message and tool usage share, and the remaining quota for 5-hour, weekly, and tool-call pools.