ADE Tools
ZCode is not only an Agent prompt box. It is a full Agent Development Environment for real development work. You can manage tasks, inspect file status, open remote workspaces, preview pages, select browser elements as context, draw on a whiteboard, and review Agent-generated changes in one window.
Workspace And File Tree
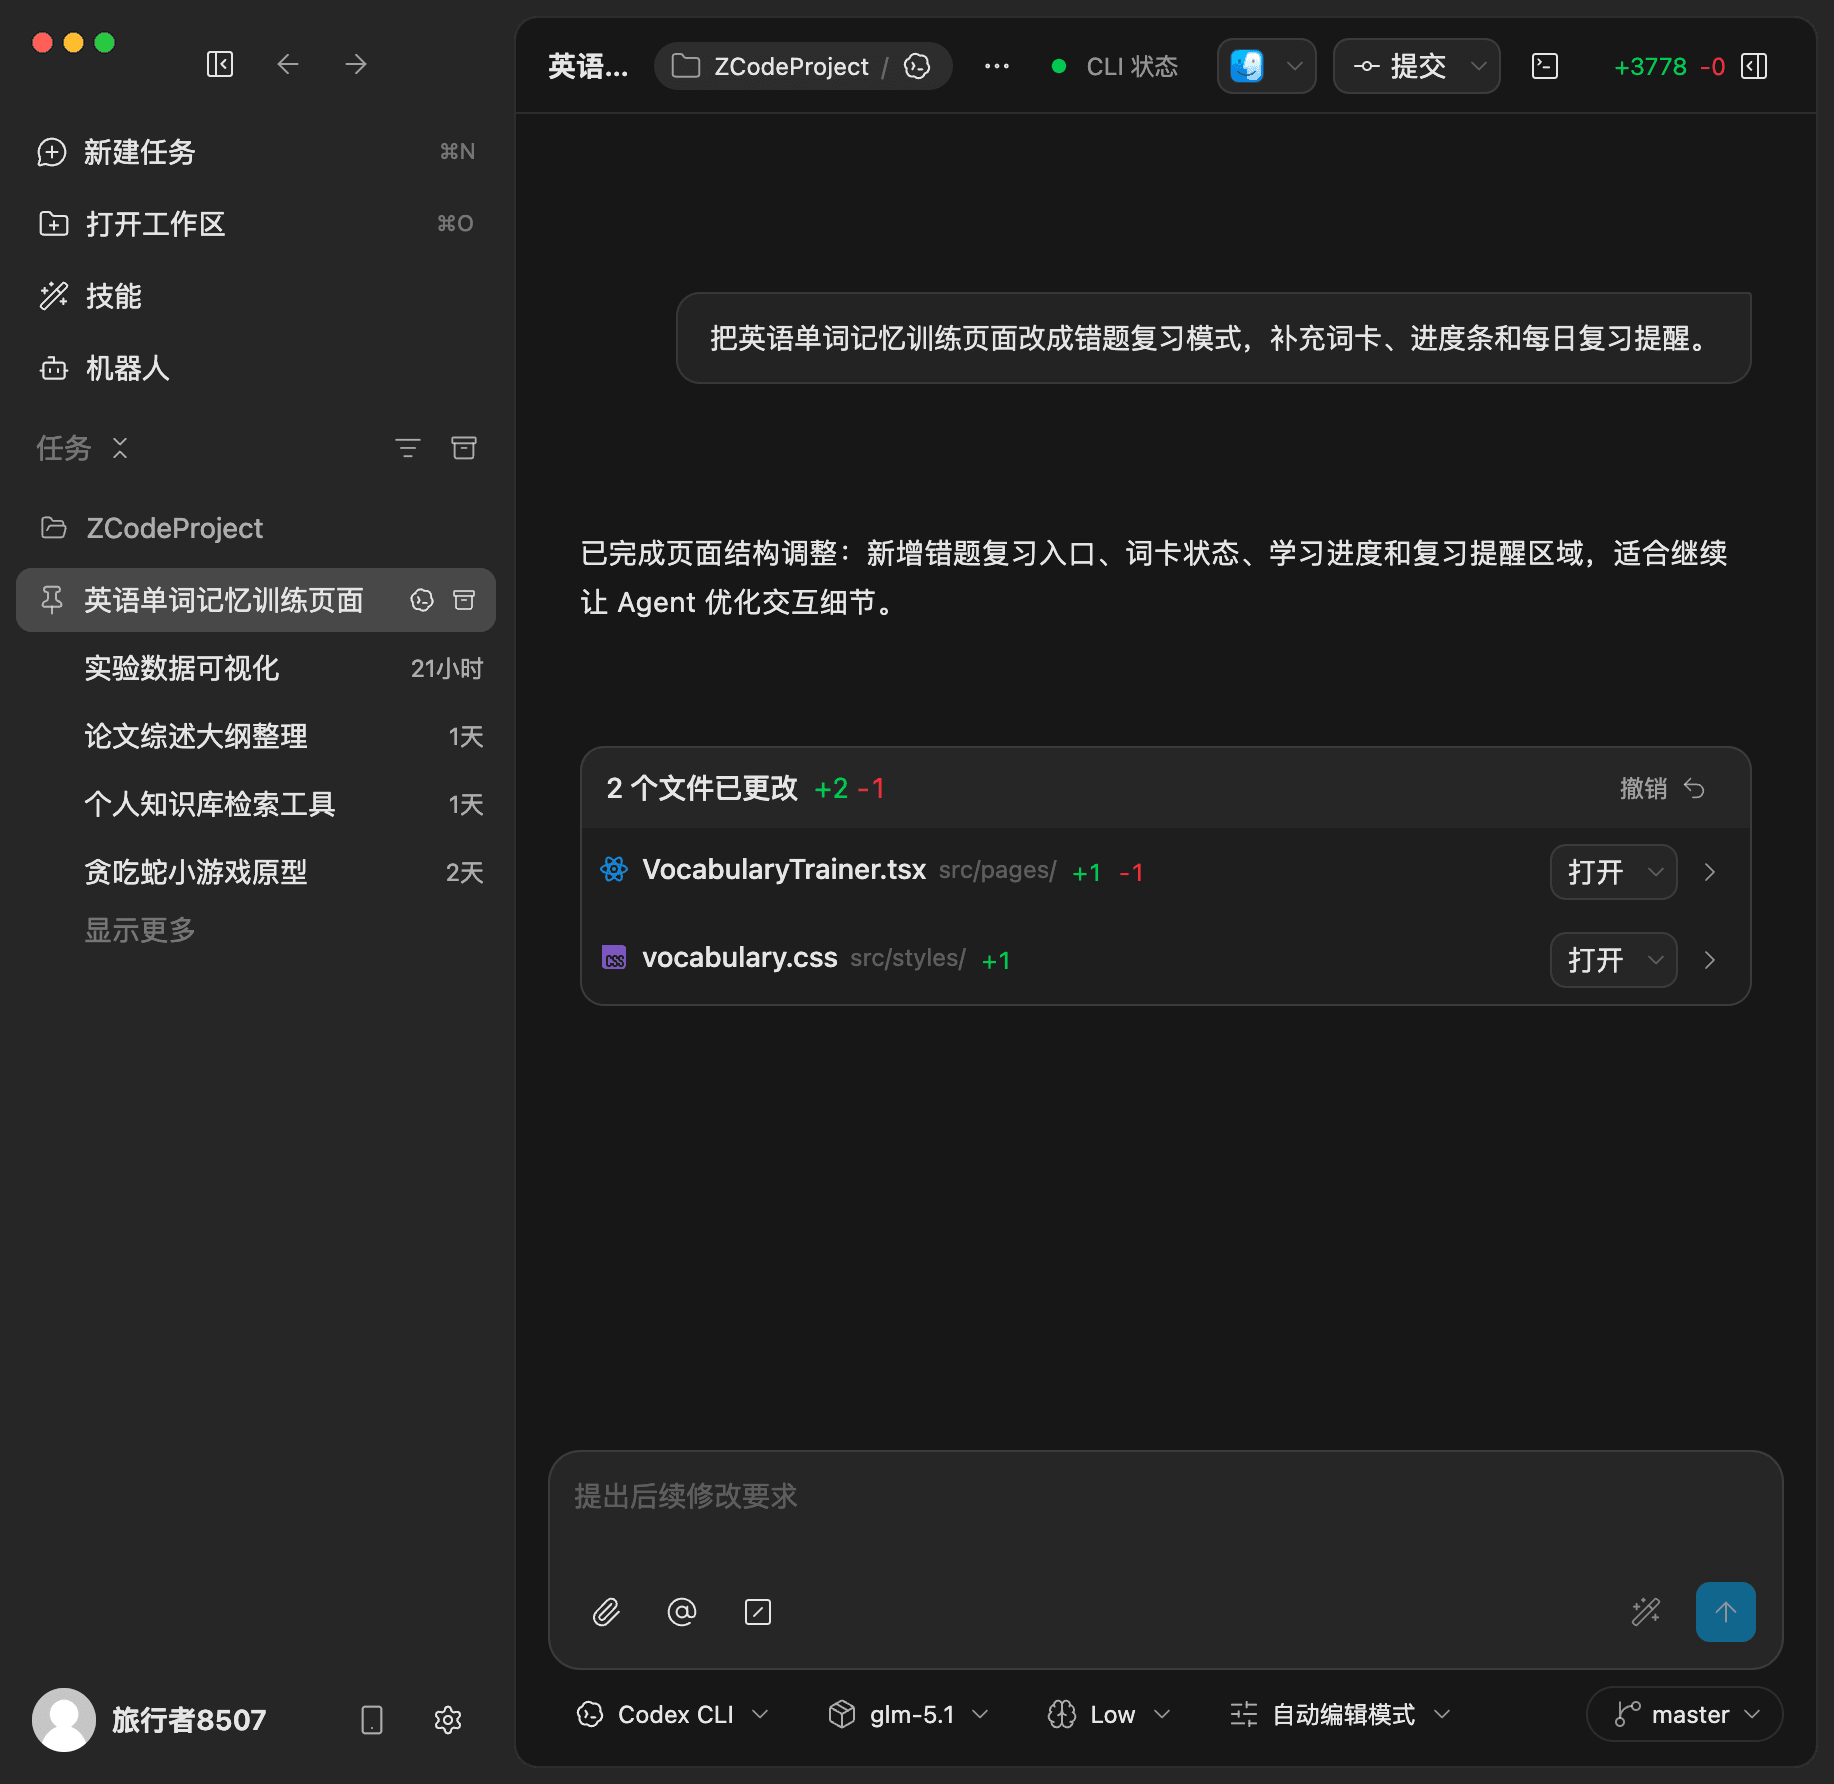
The file tree follows the current workspace and shows folders, files, and Git status. Untracked files show U, and changed folders show status dots, making it easy to see what the Agent created or touched.
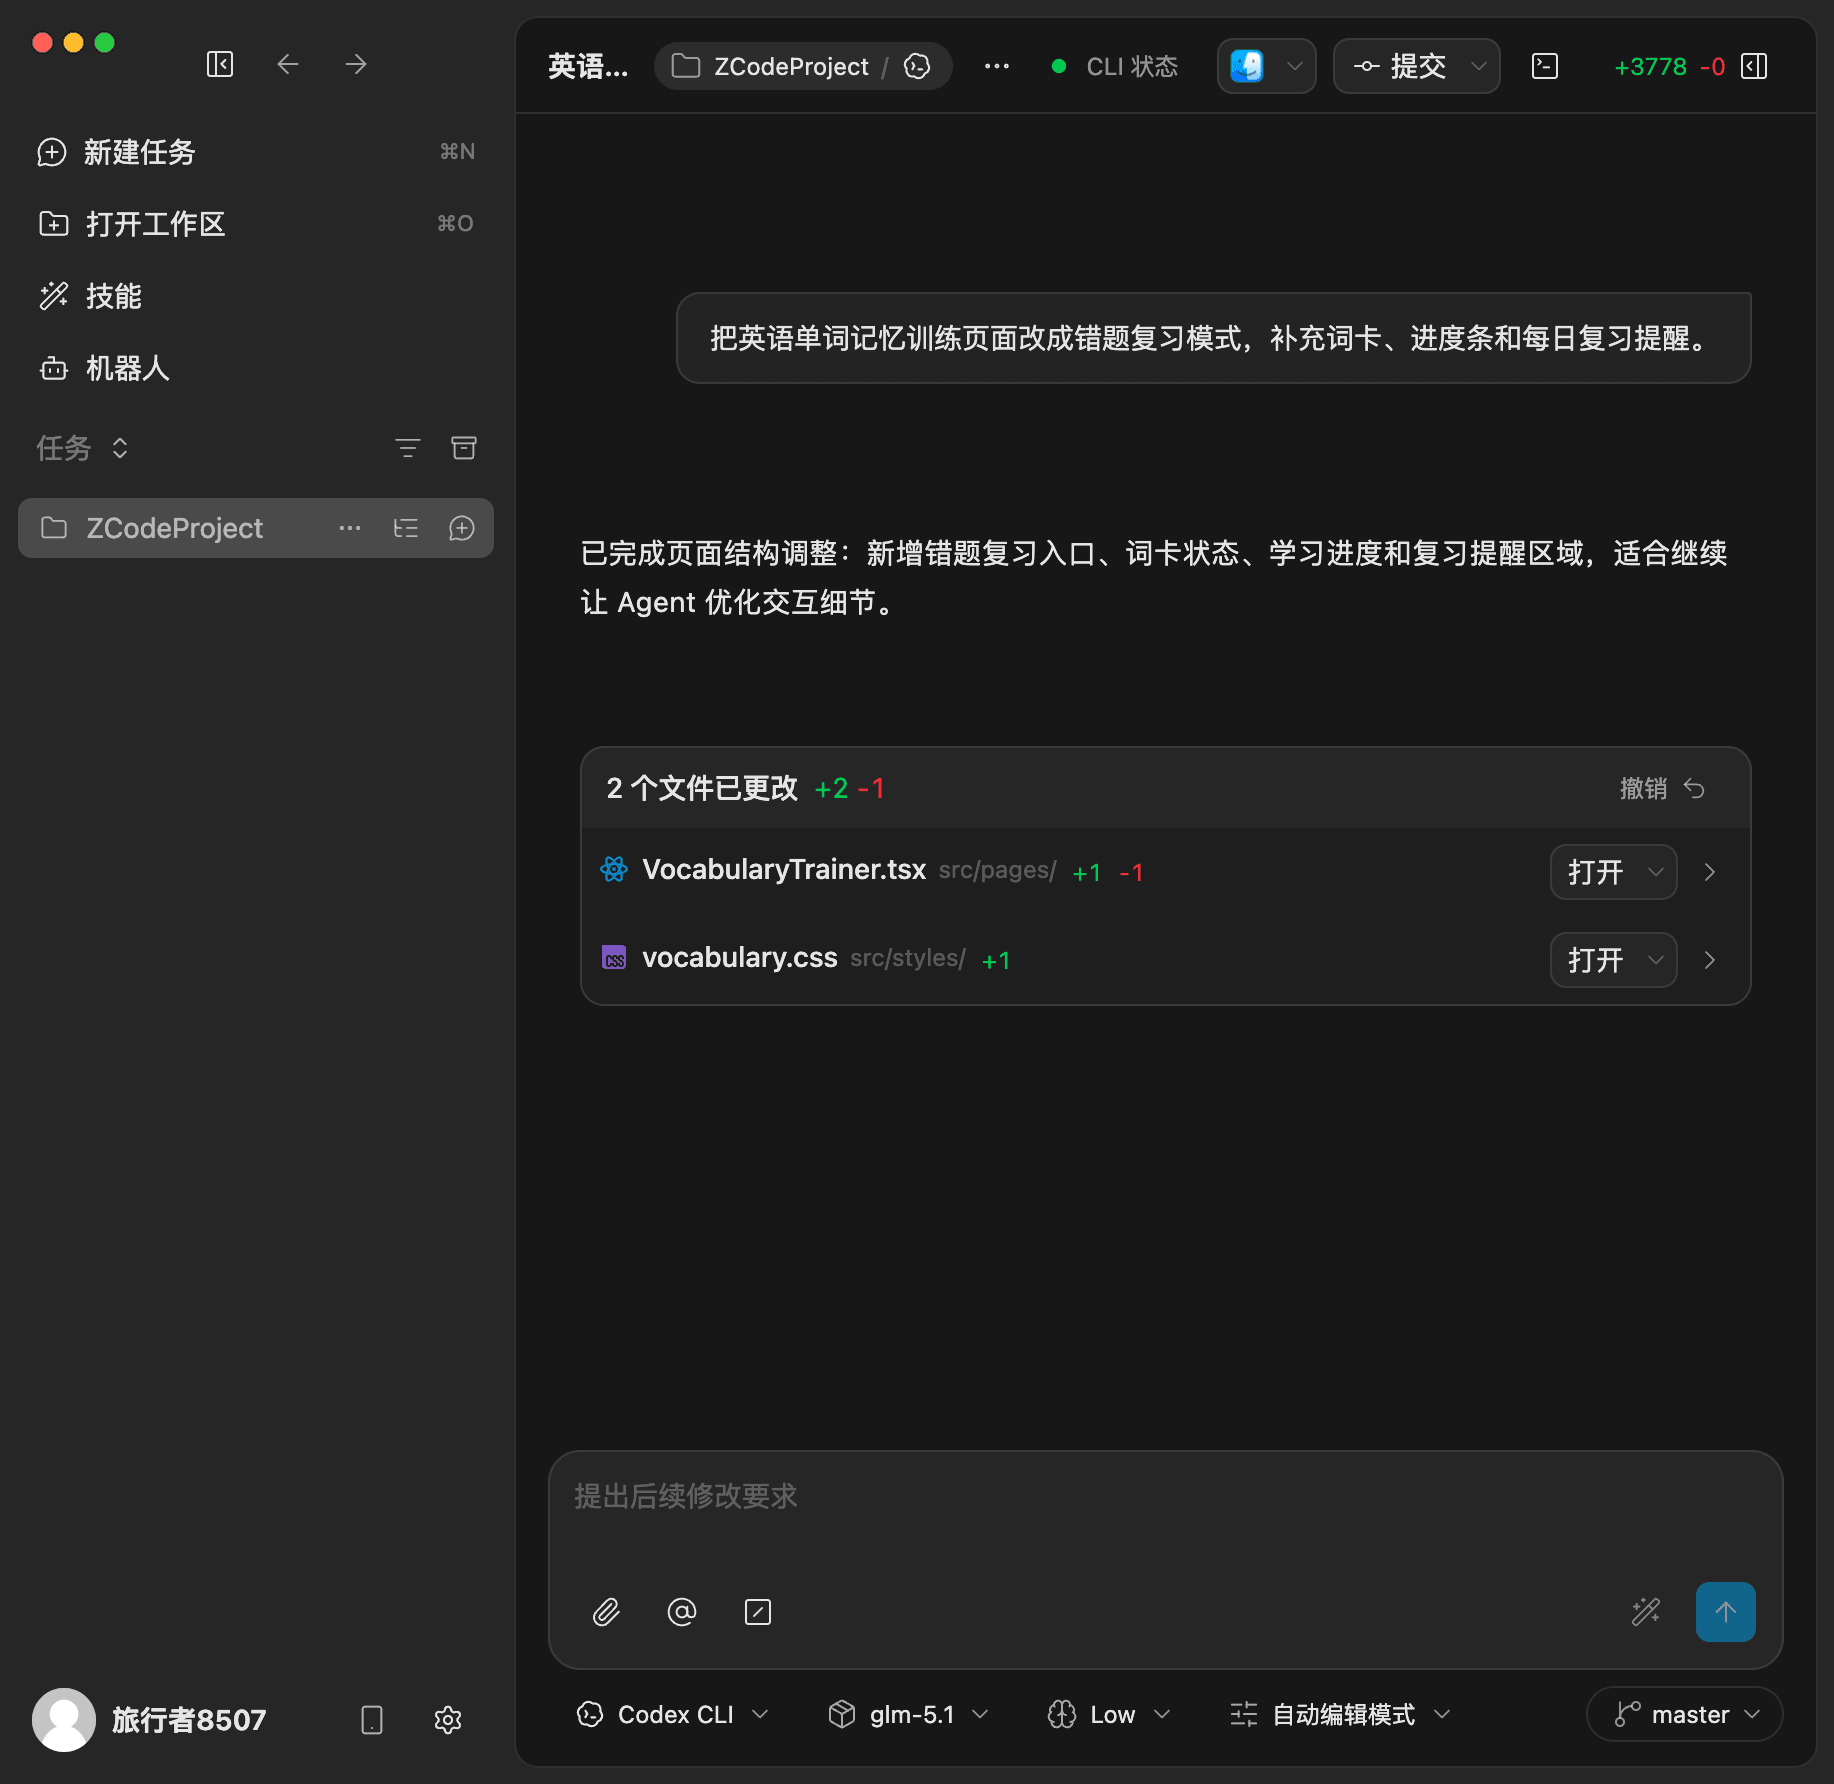
The change counter in the top bar summarizes added and deleted lines across the workspace. The Review panel lists each changed file with its own +/- count, so you can scan the scope before opening a specific Diff.
SSH Remote Workspace
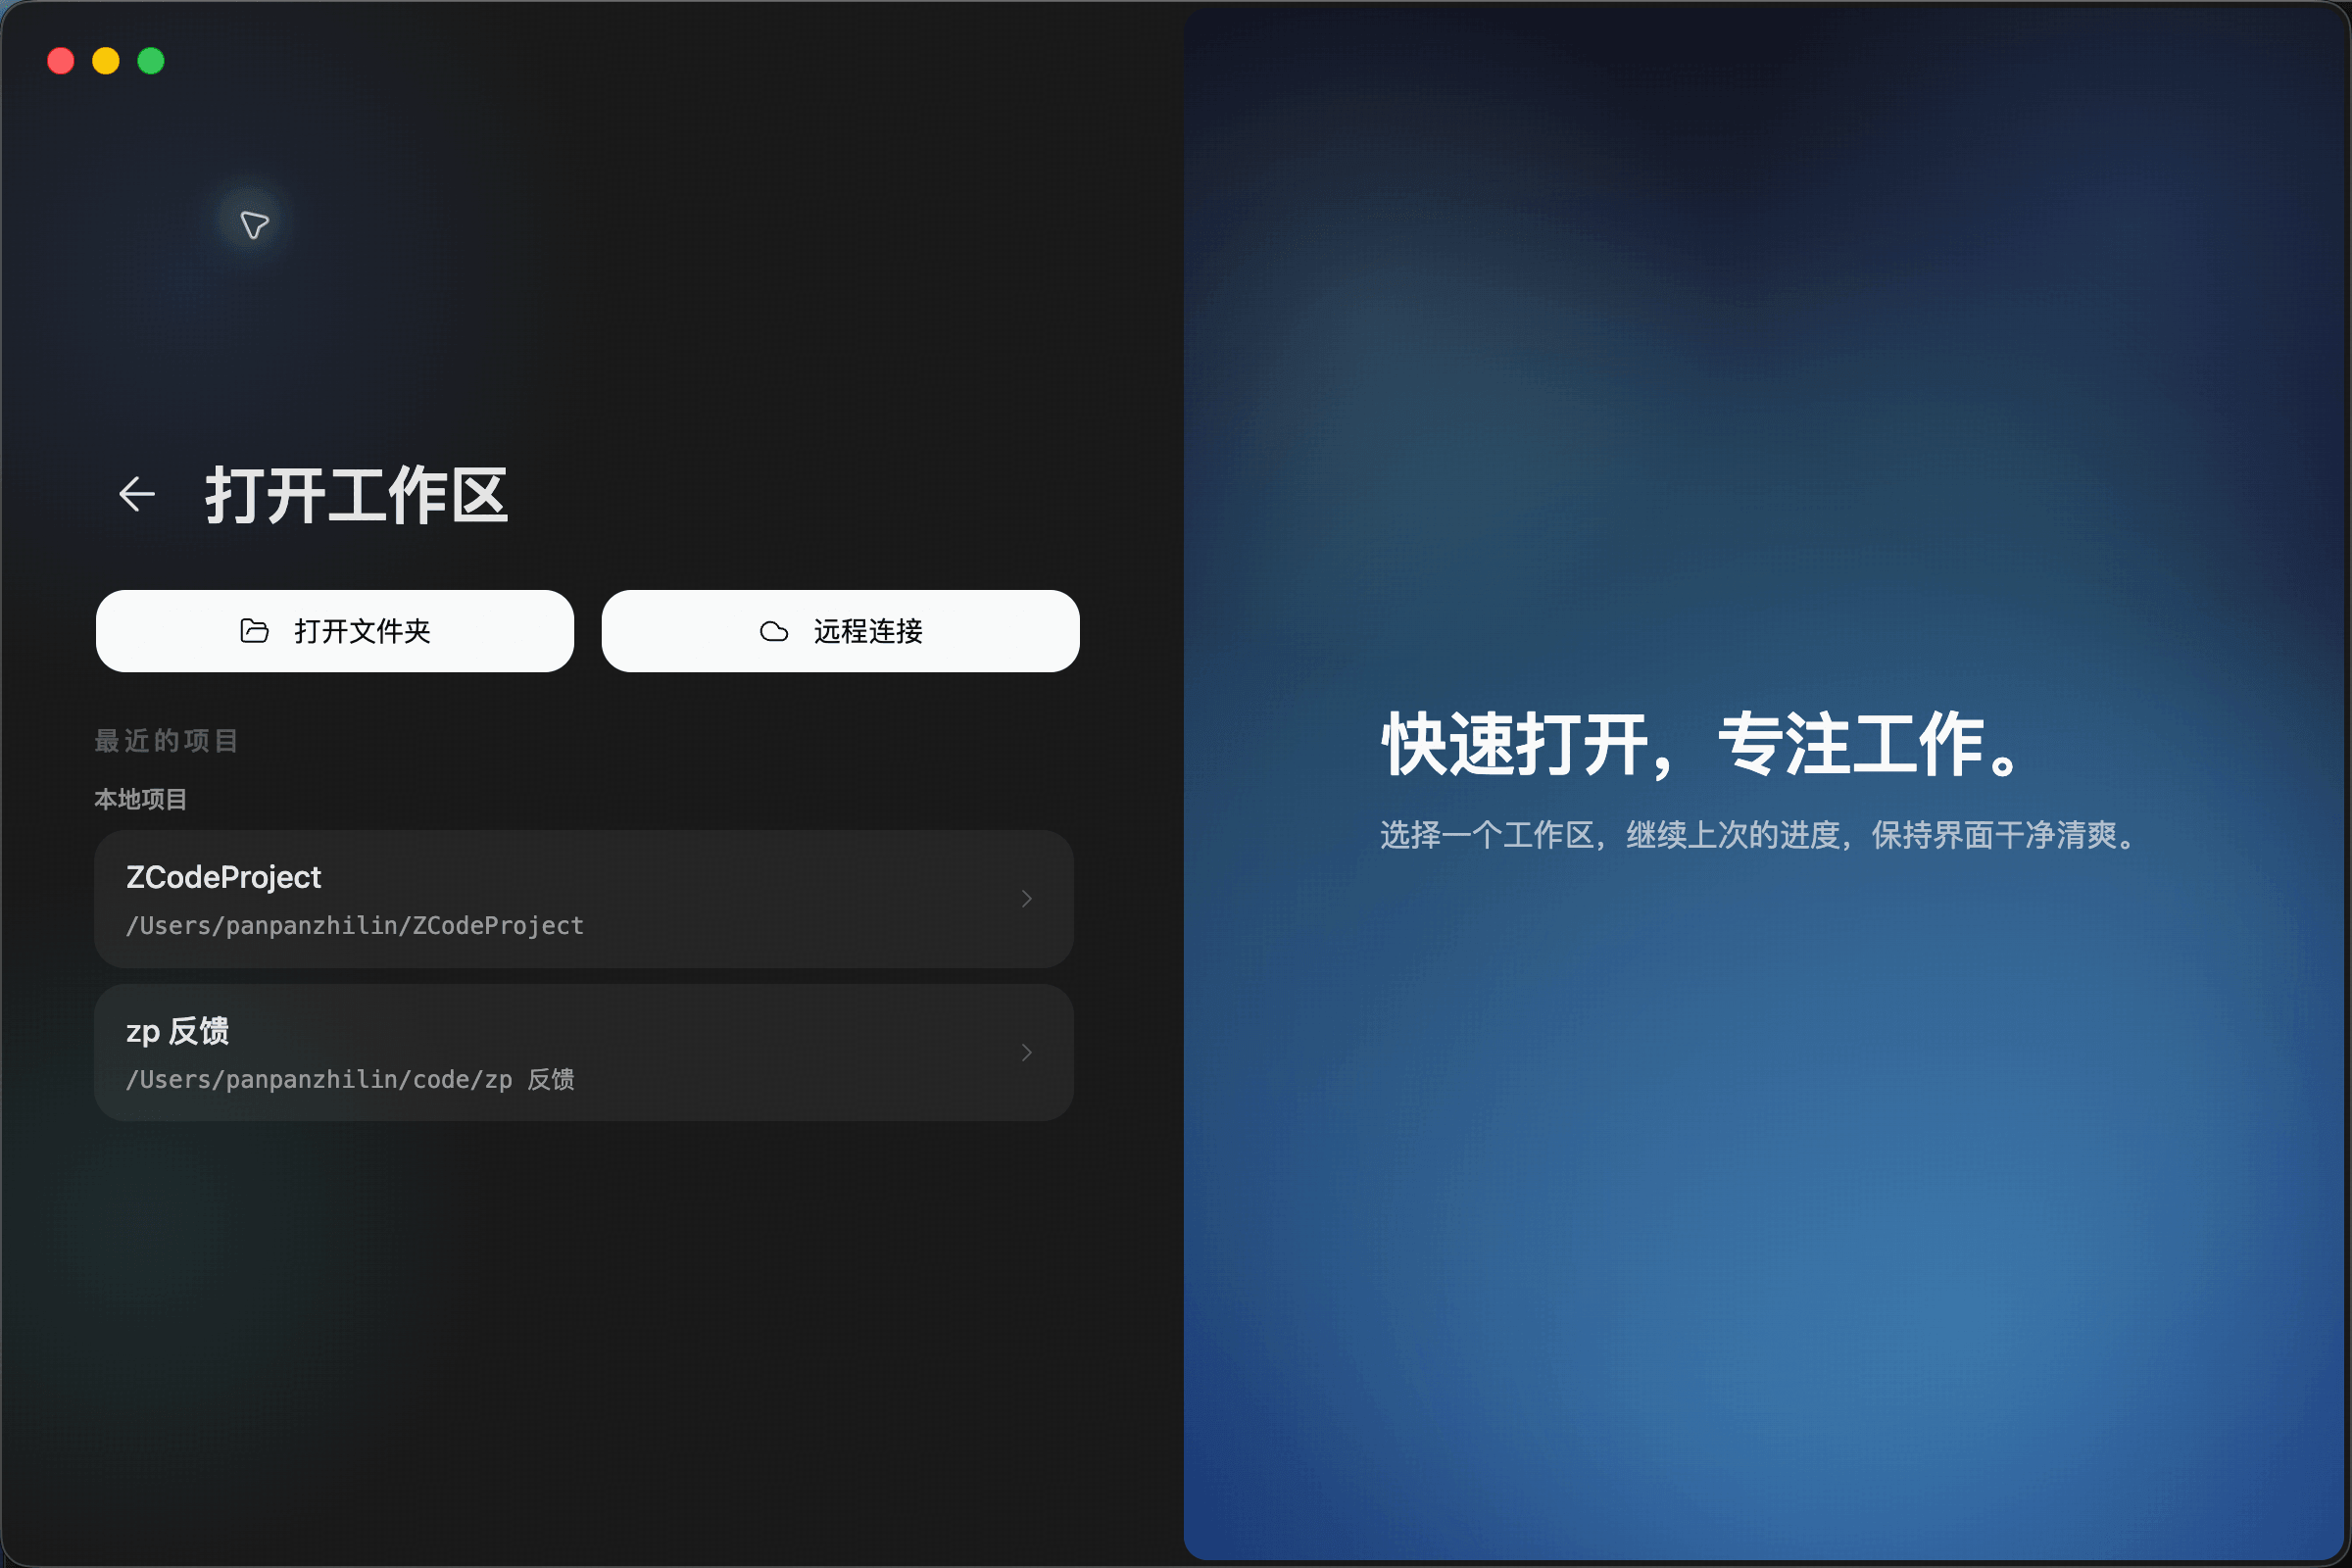
From the Open Workspace page, you can choose a local folder or start a remote connection. Remote connections are useful when you want ZCode Agent to work inside a server, development machine, or container environment.
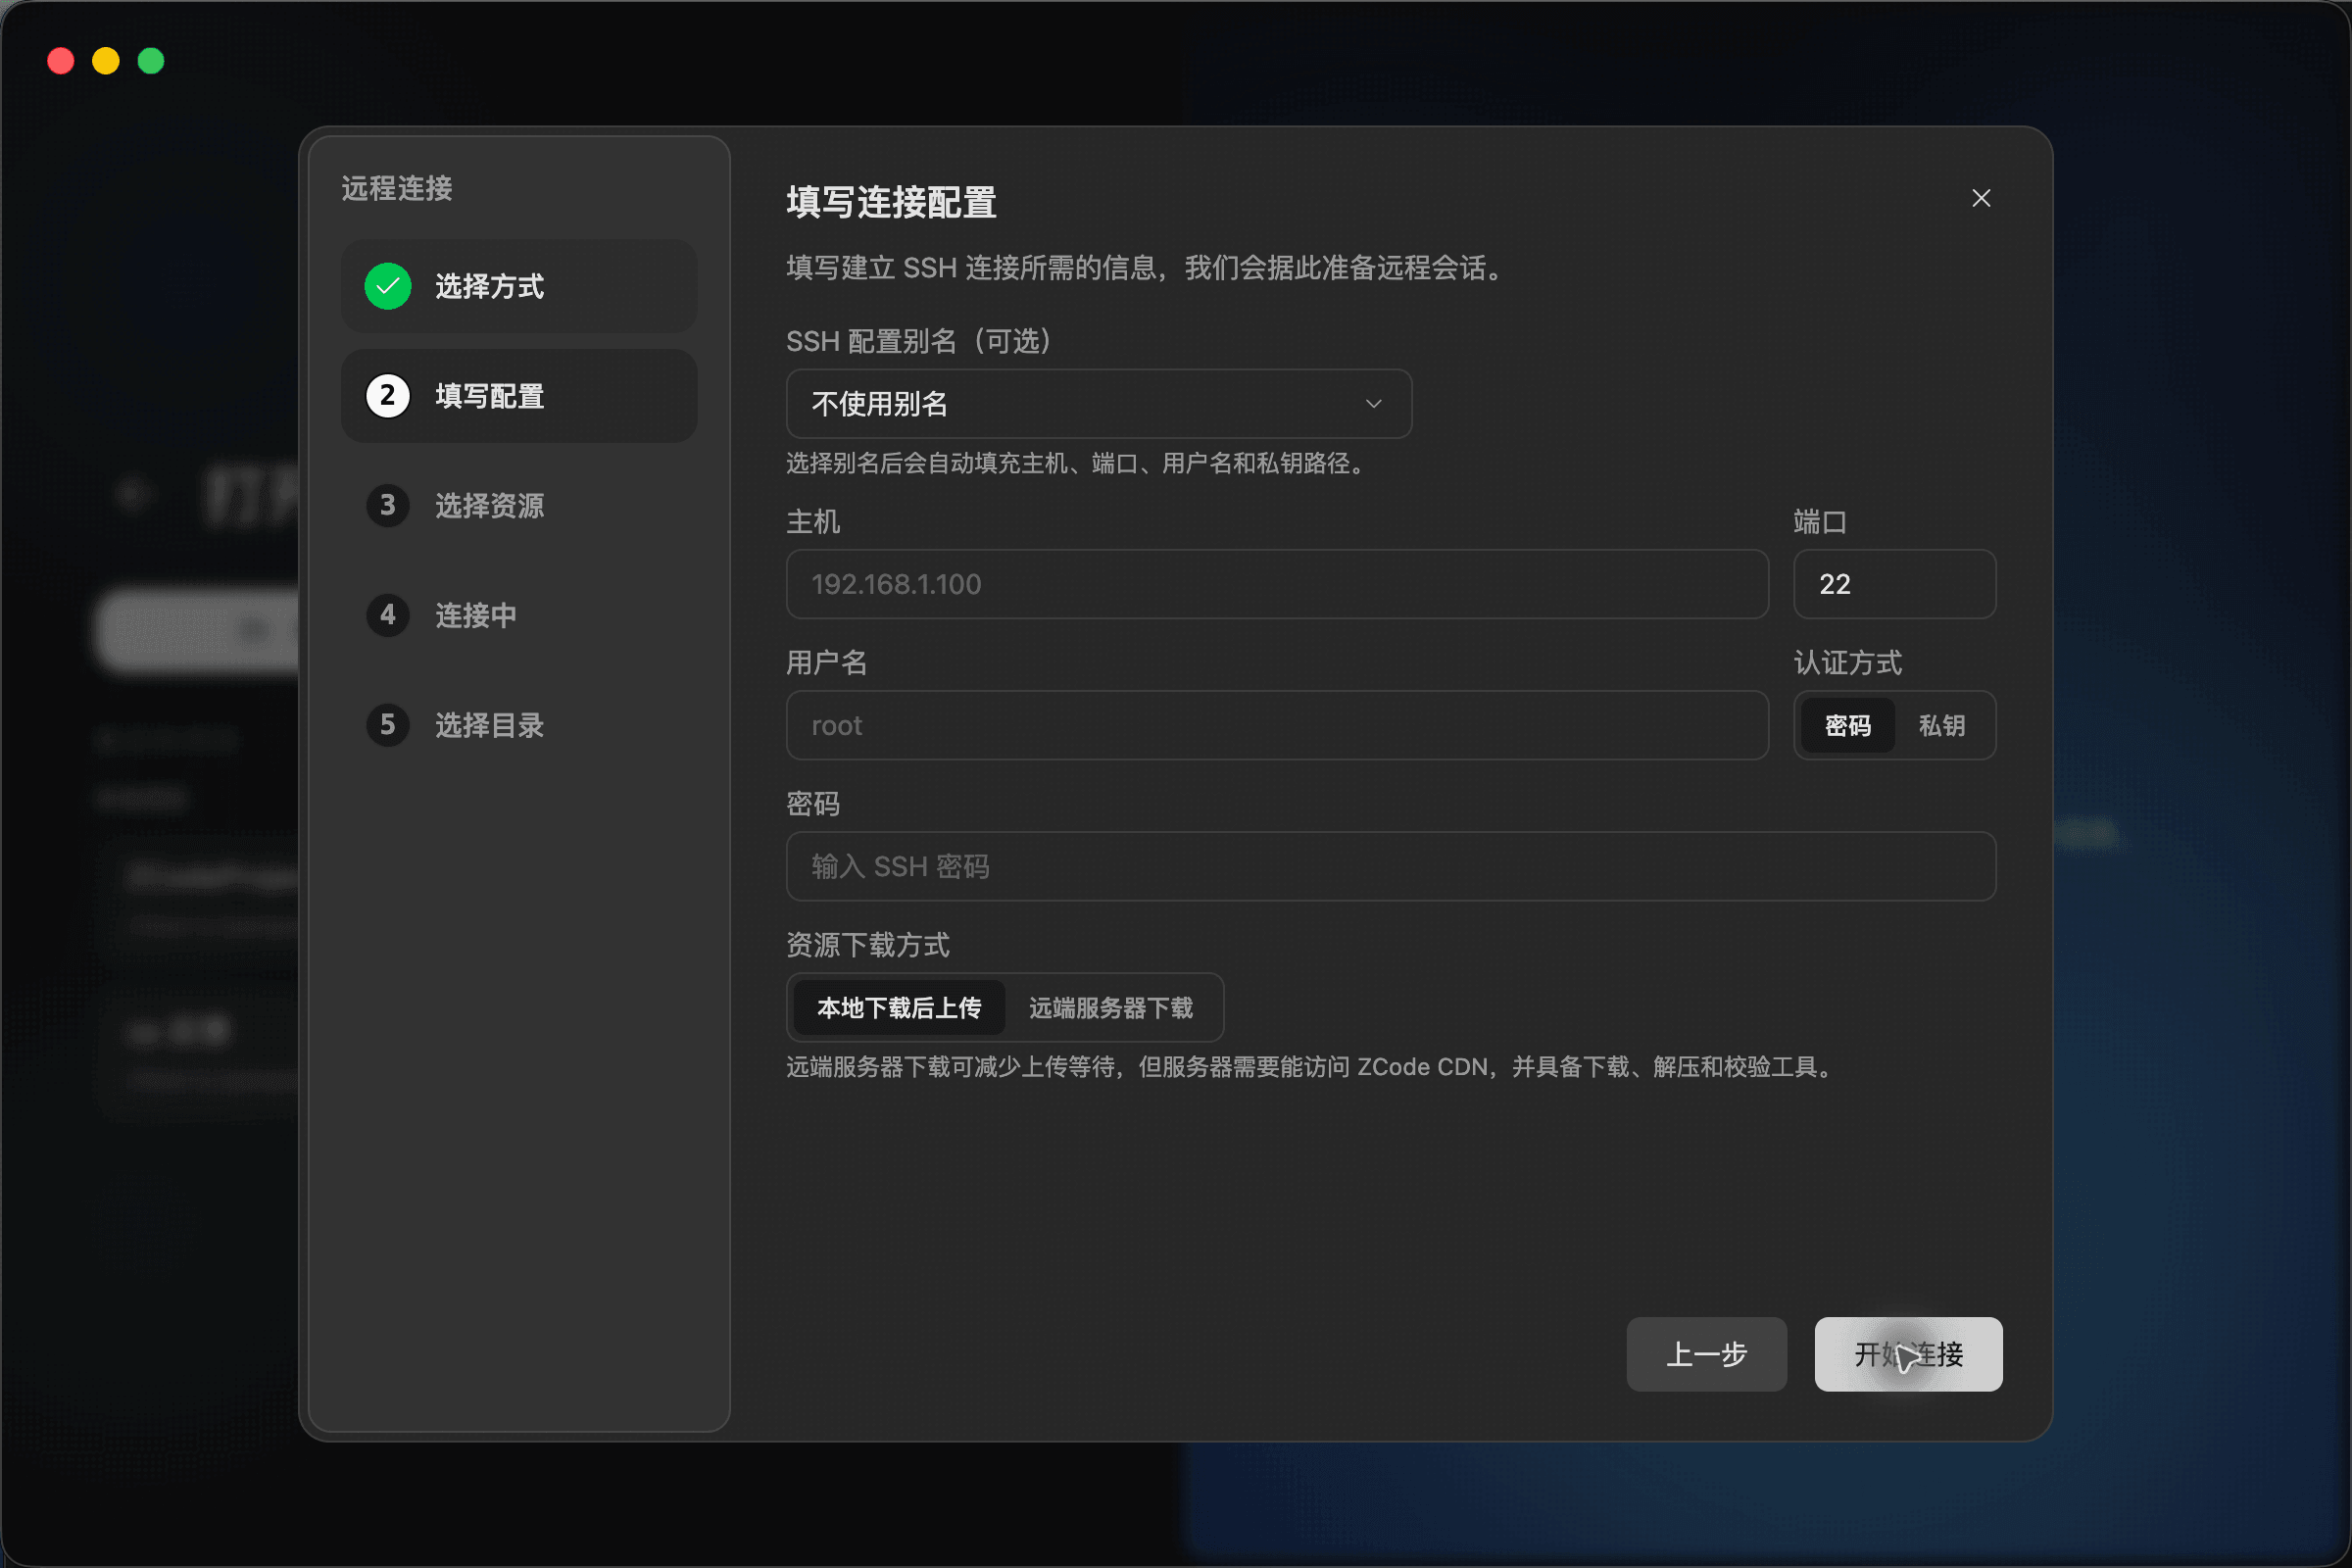
Remote connection starts with the connection method. ZCode currently shows SSH remote host and Docker local container options.
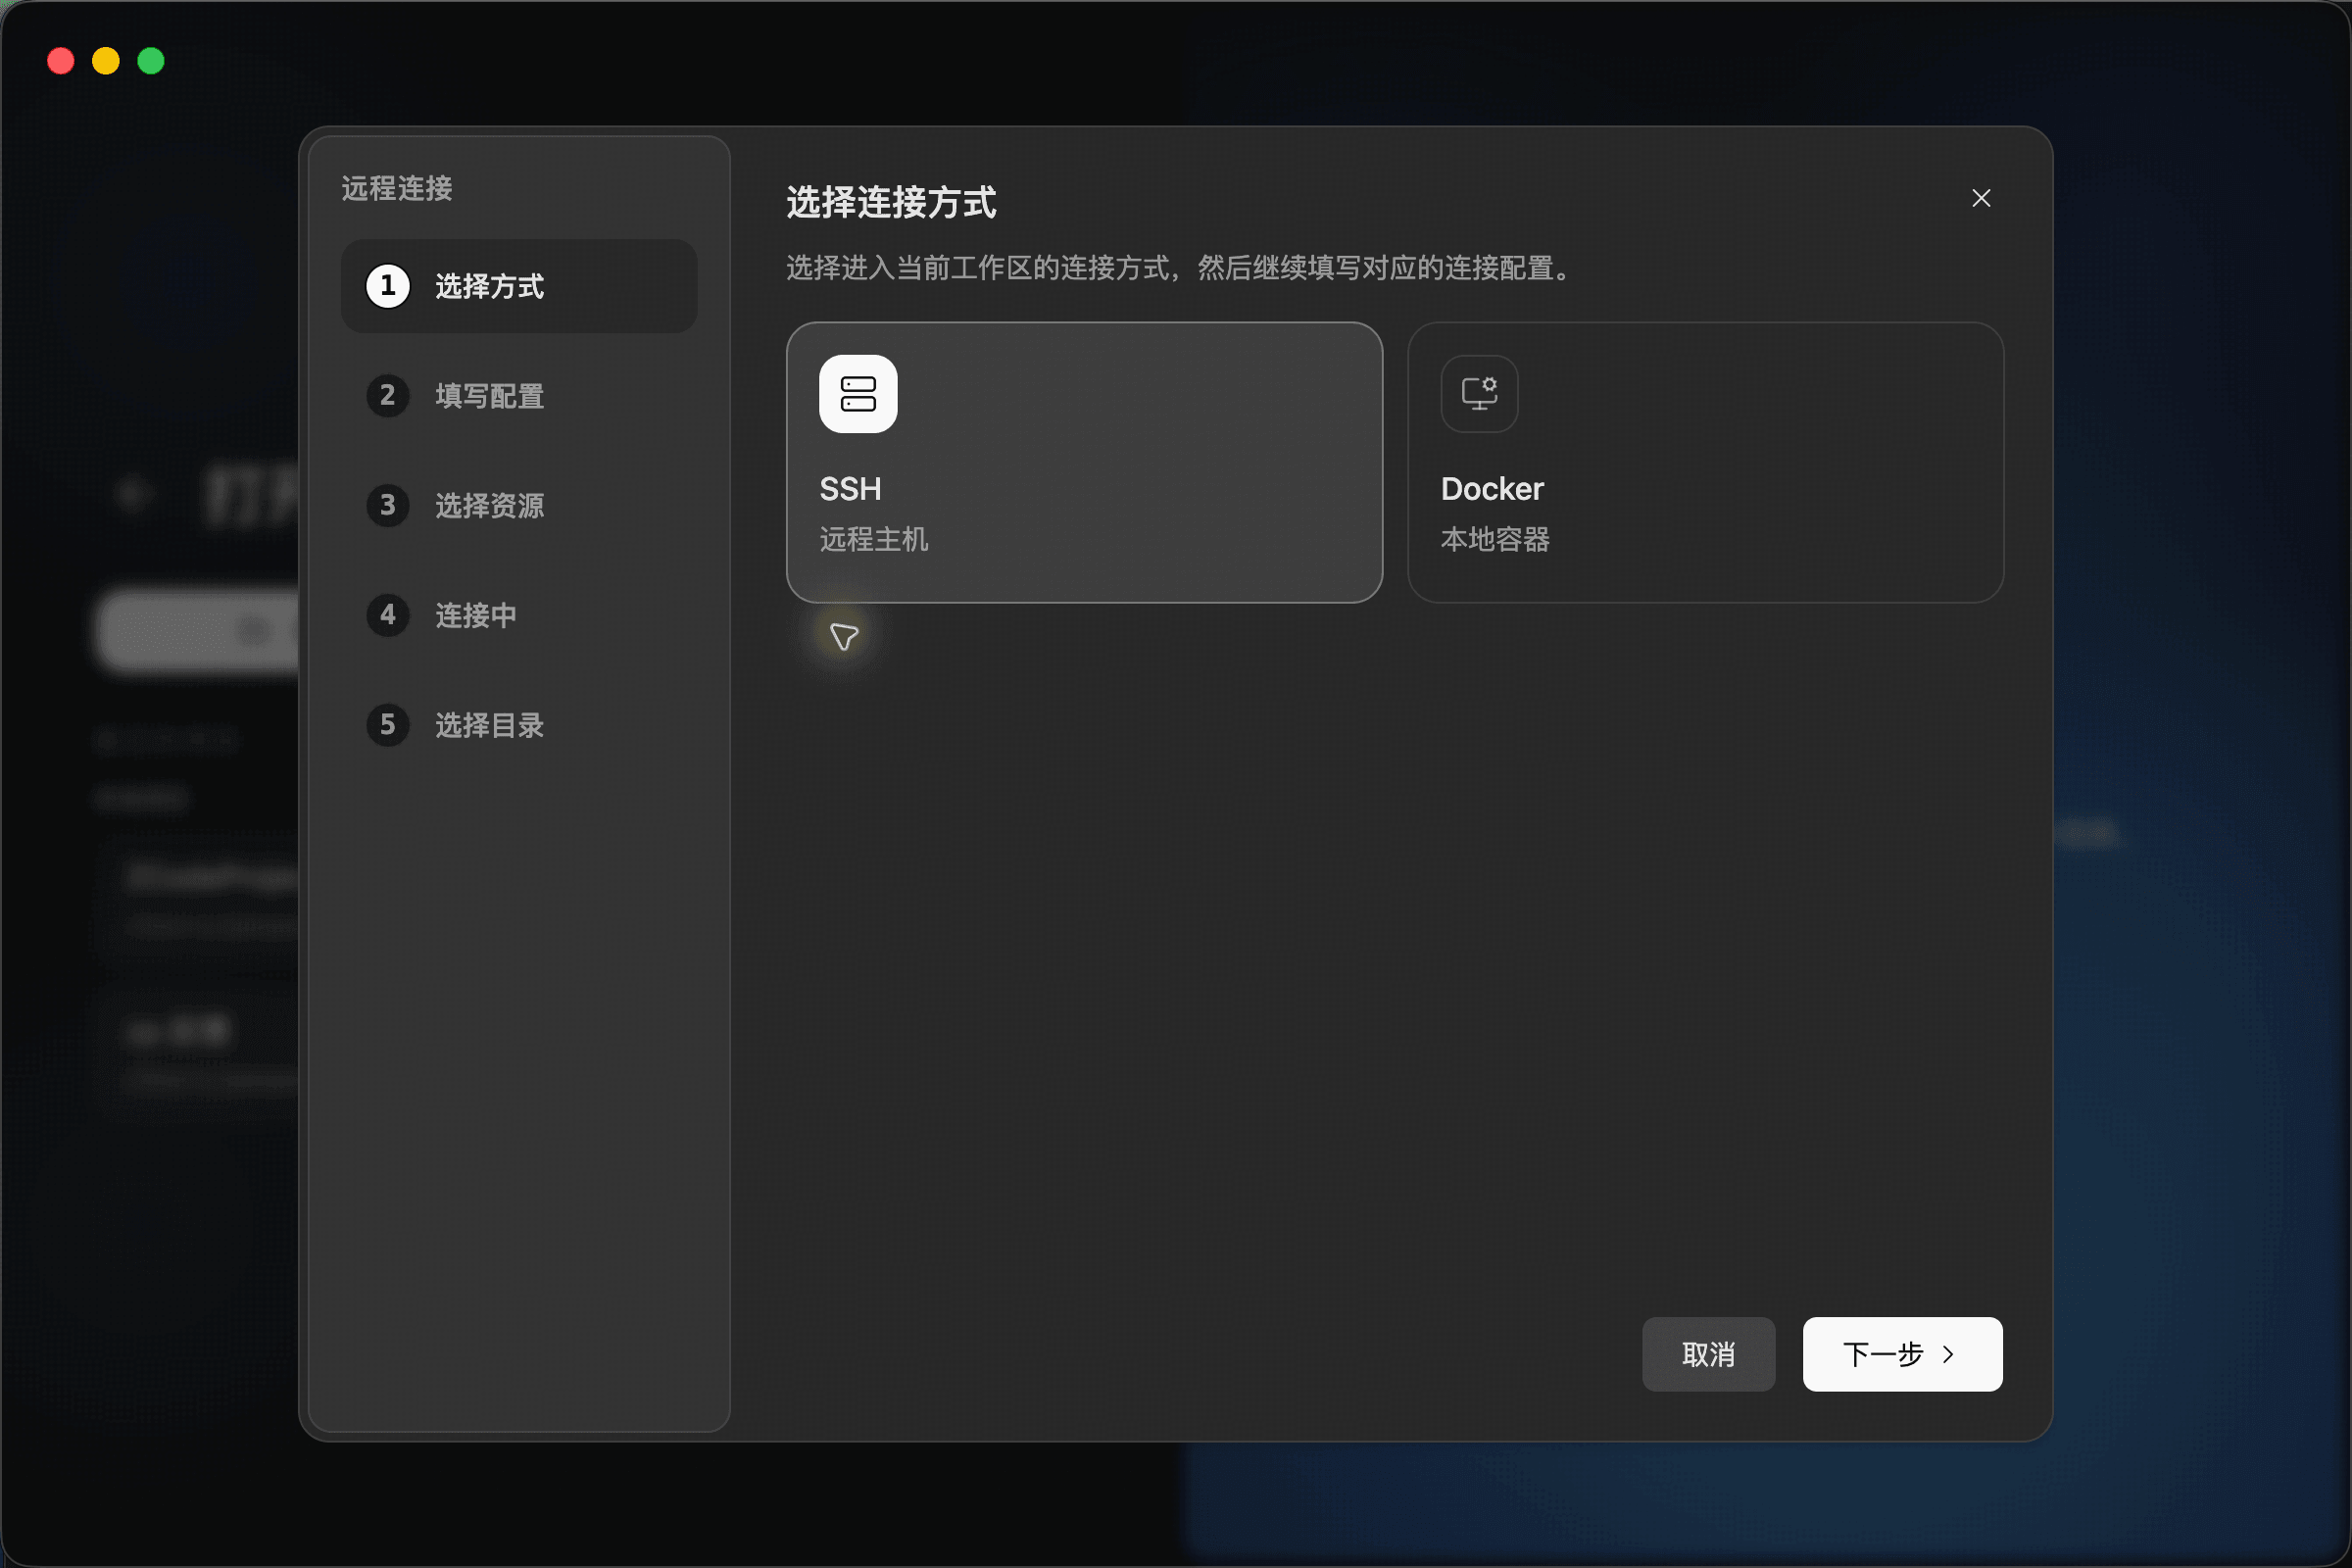
After choosing SSH, enter the host, port, username, password or private key, and resource download method. ZCode then prepares the remote session and lets you choose the remote directory.
Whiteboard Context
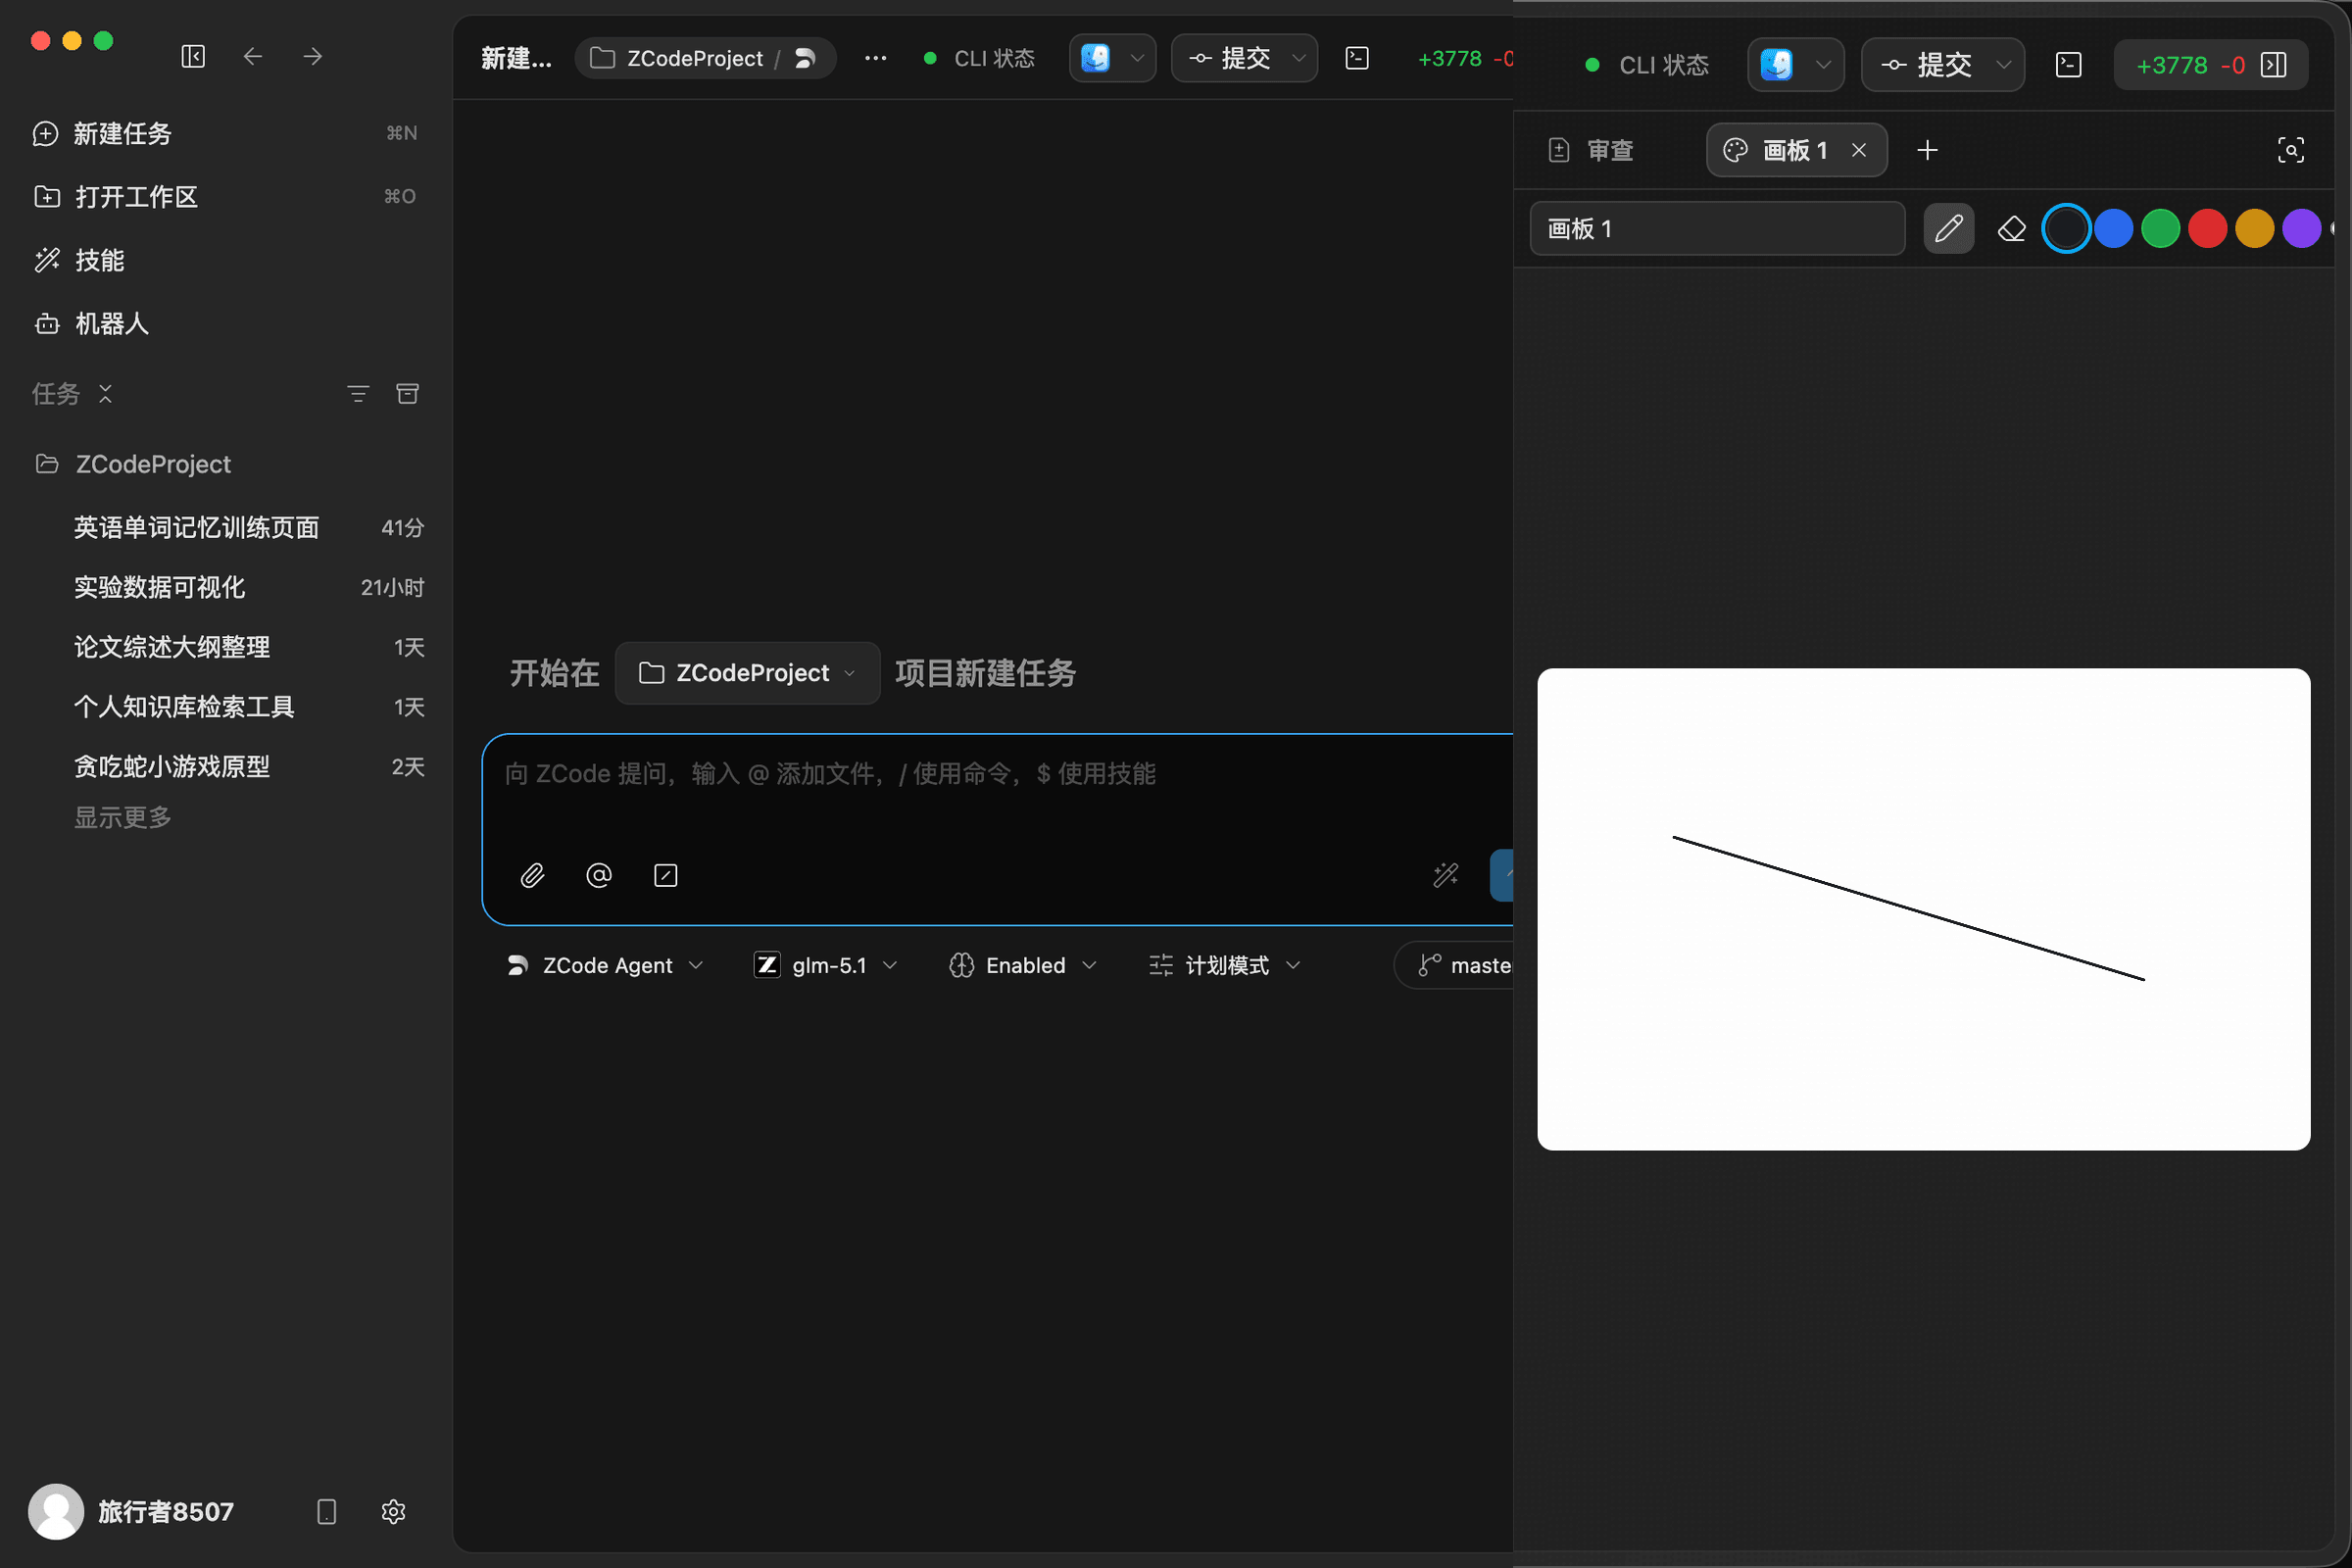
The right-side panel can create a Whiteboard tab. Use it when a layout, flow, UI issue, or visual idea is easier to explain with a quick sketch than with text.
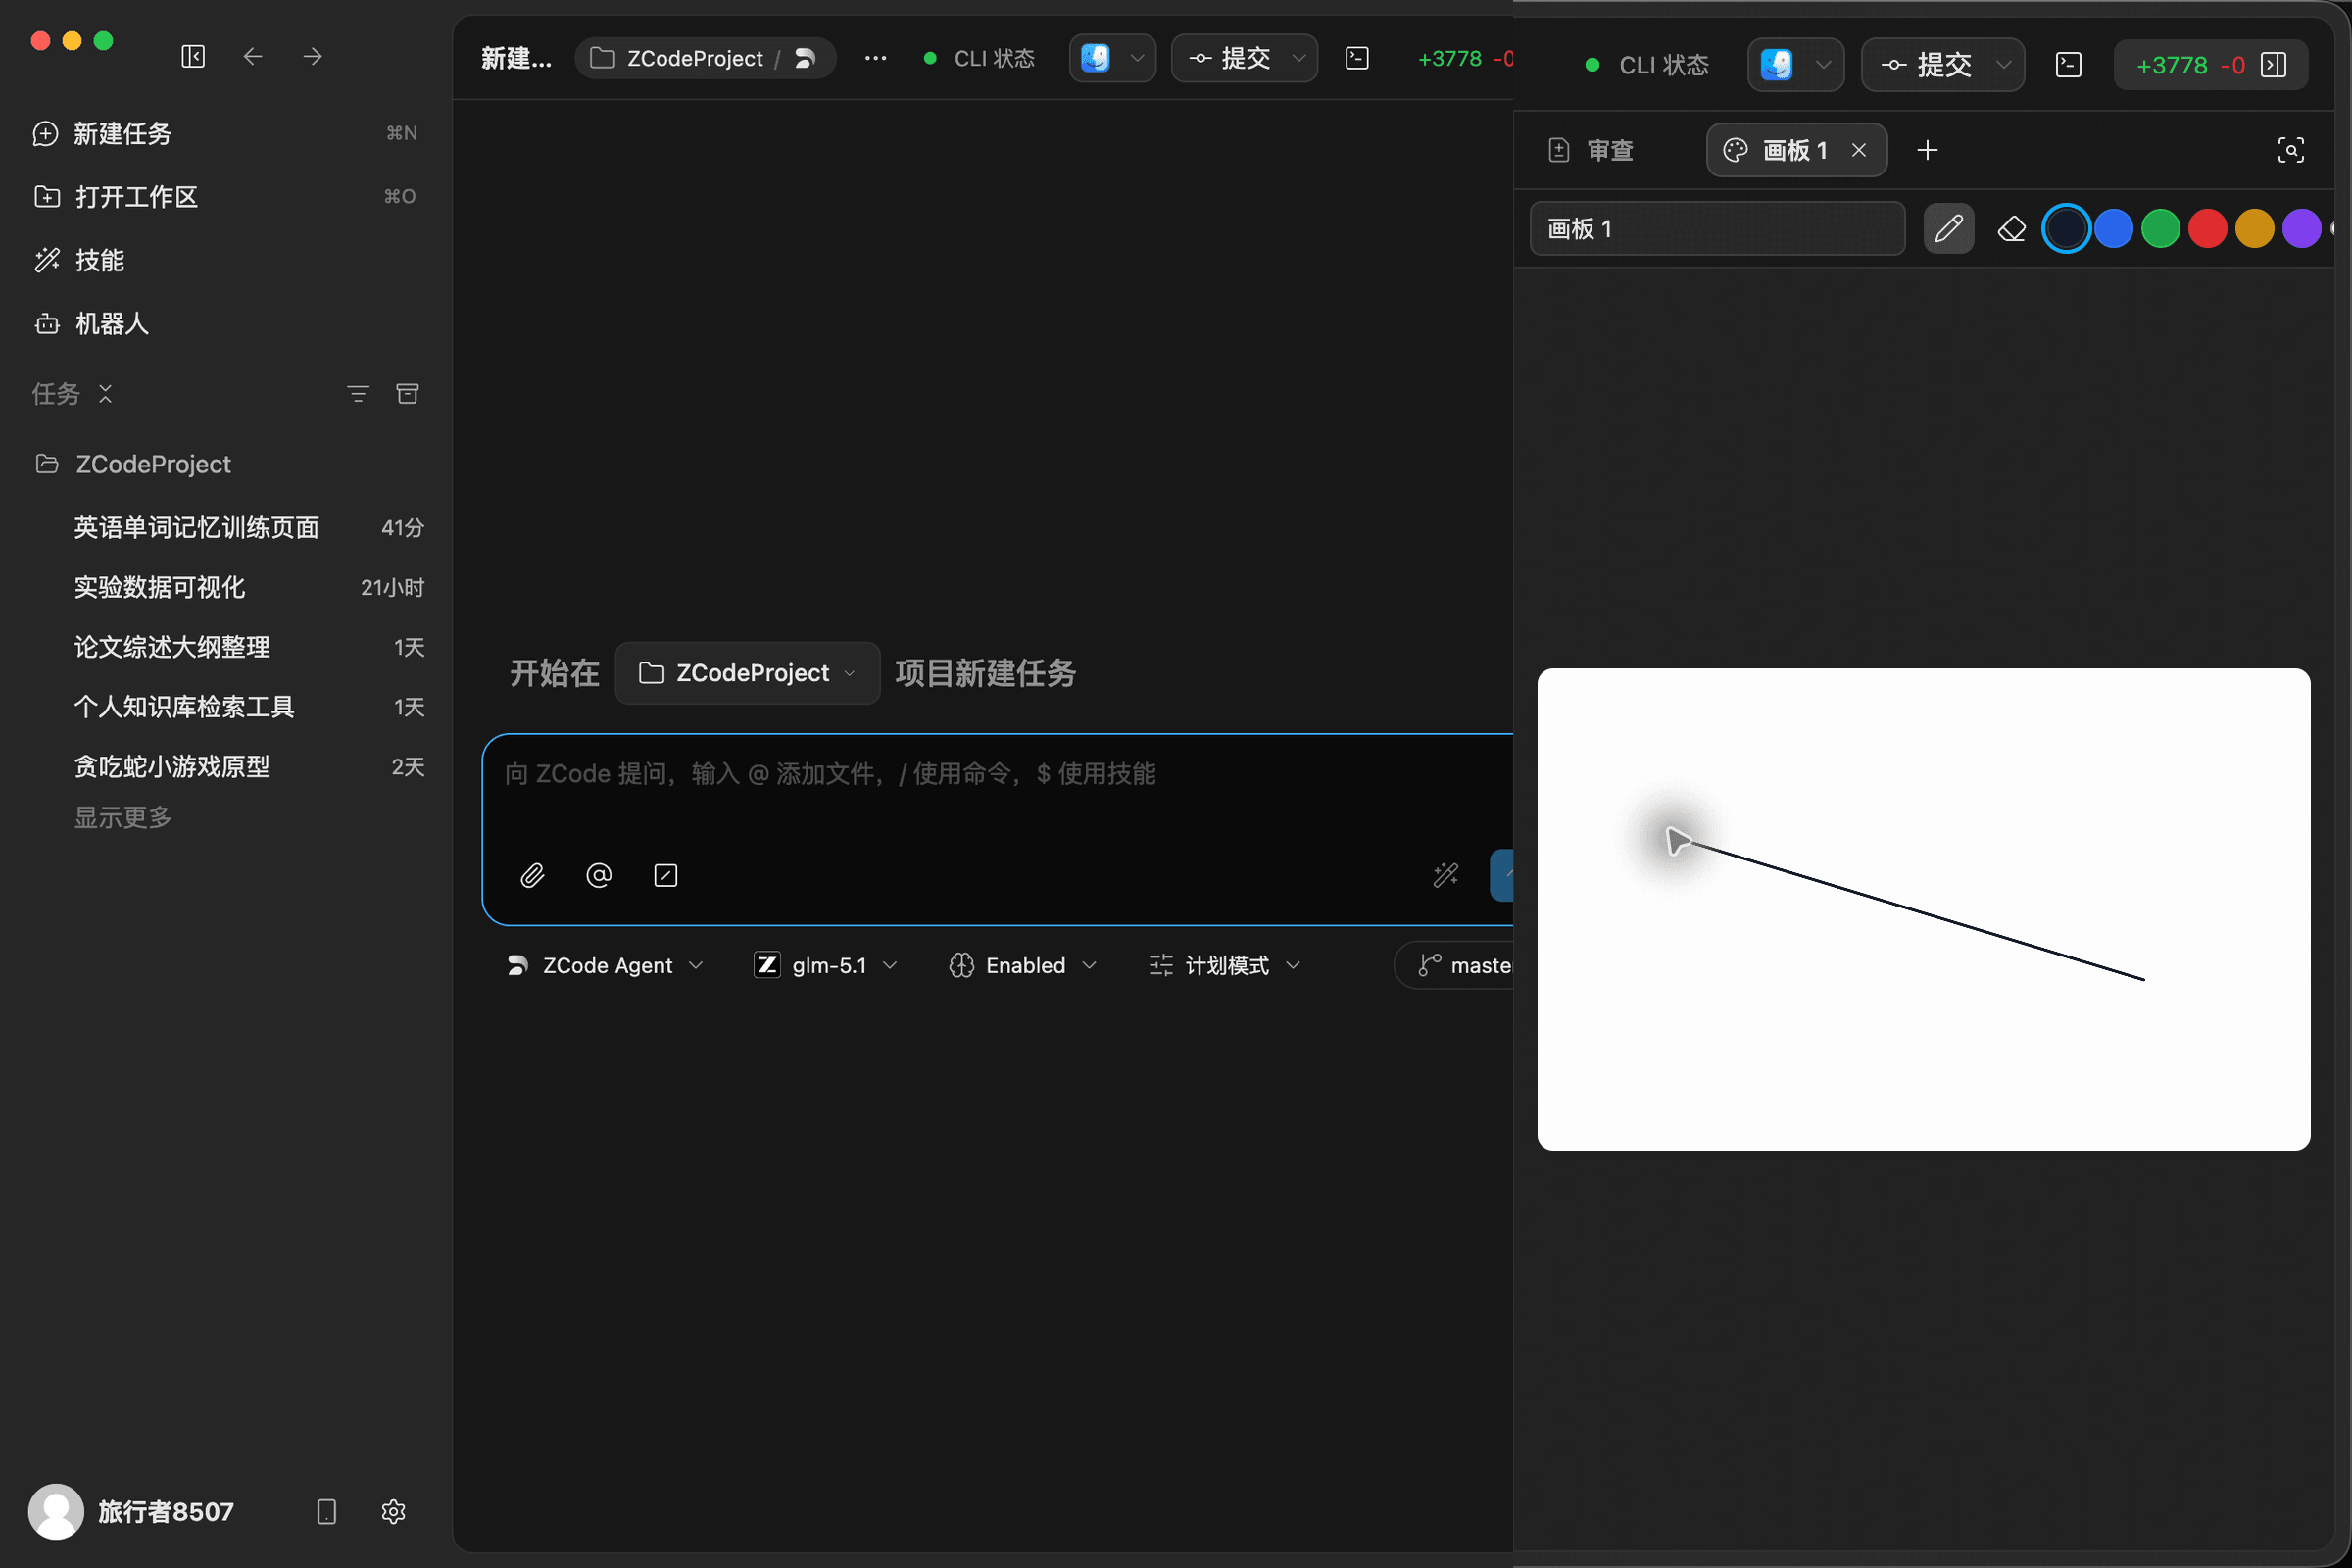
Whiteboards are saved per workspace. Open the @ context picker in the composer, choose a whiteboard from the current workspace, and ZCode exports it as an image attachment for the Agent.
Browser Element Context
The built-in browser can preview local pages and turn page elements into Agent context. Open a Browser tab, enter a local or remote URL, then click the element picker button in the toolbar.
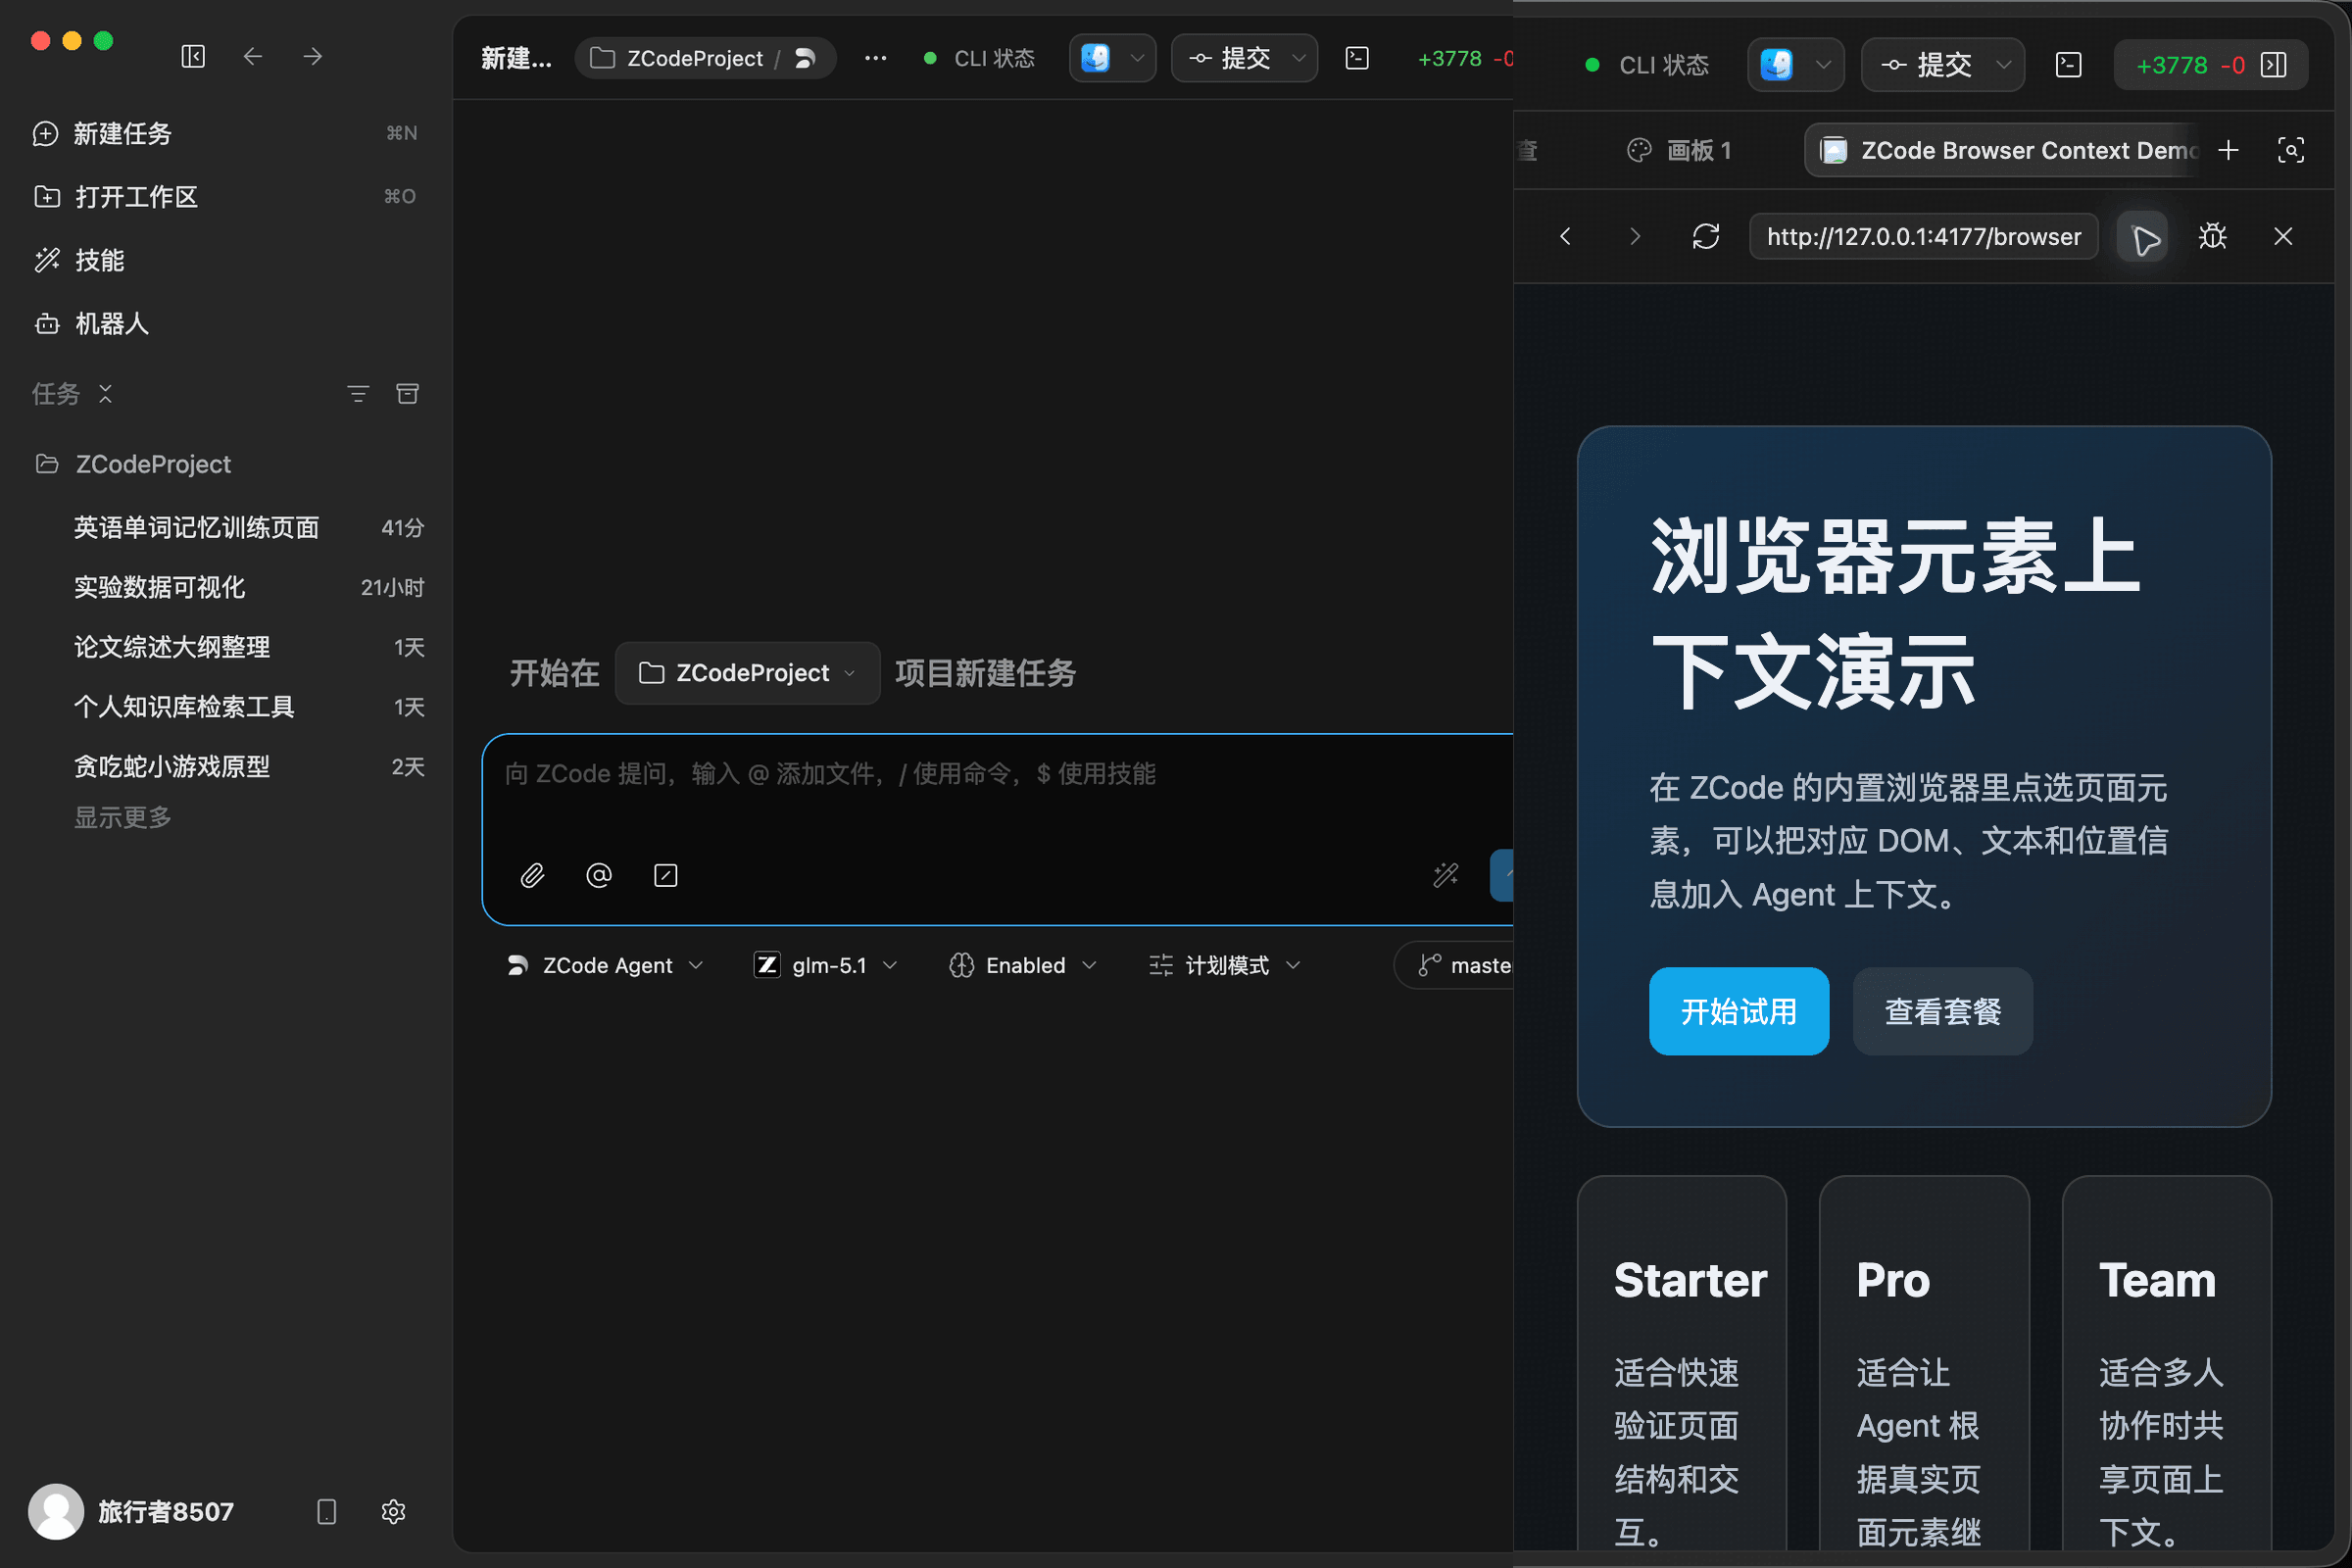
In picker mode, click a button, card, heading, or any other DOM element on the page. ZCode captures the page title, URL, element text, selector, position, and a safe HTML summary, then adds that context to the current chat. This lets you ask the Agent to modify “the selected card” or improve “this button copy” without describing the element manually.
Terminal And Debugging
Use the terminal button in the upper-right corner or Command + J to open the terminal panel. You can run builds, tests, development servers, and logs inside the same workspace, then continue the conversation with the Agent.
The built-in browser also includes a DevTools entry for frontend debugging, so preview, DOM inspection, console output, and Agent work stay close together.
Remote Access
ZCode remote access has two entry points: Remote Control for scanning a QR code from your phone and controlling the current workspace, and Bot Channel for opening a workspace from WeChat, Feishu, or Telegram.
Remote Control
Connect to the current ZCode workspace from your phone.
Bot Channel
Open a workspace from chat tools through Bot Channel.